


Key Details:
- Three different sources of housing price research—Fannie Mae, NAR and Redfin—have reported home price changes for Q1 and March of 2023. At first glance, the opposing headlines could be confusing to consumers.
- Zillow’s latest research points to greater challenges for entry-level home shoppers, with bigger jumps in home prices and a more pronounced shortage of inventory.
New housing reports from Fannie Mae, National Association of REALTORS® (NAR), and Redfin present the latest data on home prices, with one focusing on the first quarter of 2023 and the others zeroing in on March.
At first glance, the headlines could be confusing to consumers since Fannie Mae is reporting an increase in home prices for Q1, while Redfin announced a 3.3% annual drop in home prices and NAR a reported 0.9% price decline year-over-year.
All the more reason for you as a real estate agent to stay current on market data and to present the latest developments as clearly as possible—especially when sharing hyper-local market data. Potential buyers and sellers in your area need to know exactly what they can expect.
In addition, the latest Zillow research focuses on the challenges entry-level buyers, in particular, are facing in today’s market with respect to home prices, inventory, and competition. Because what’s happening at the national level doesn’t address trends at different price points, let alone what’s happening in your local market.
Here’s what you need to know to better educate your clients and community.
Quick summary of the headlines
According to the Fannie Mae Home Price Index (FNM-HPI), single-family home prices rose at a non-seasonally-adjusted annual rate of 4.7% in Q1 of 2023 (compared to Q1 2022), dropping from the previous quarter’s revised annual growth rate of 8.6%.
On a quarterly basis, home prices increased at a seasonally-adjusted rate of 1% in Q1 2023—up from the 0.0% growth rate from the previous quarter (Q4 2022). The quarterly growth rate for Q1 2023 on a non-seasonally adjusted basis is also 1%.
Taking a different angle on the market, the latest report from Redfin announced a 3.3% annual drop in the median home price for March—the steepest year-over-year decline since 2012.
A new report from the National Association of REALTORS® (NAR) also highlights an overall annual decline in home prices as well as home sales, along with monthly and annual increases in total inventory.
Those quarterly climbs and annual drops don’t say much about what’s happening at different price points and in different markets across the U.S., which is where the latest research from Zillow comes in.
Entry-level home shoppers, the main focus of Zillow’s report, are faced with faster-rising home prices and stiffer competition than home shoppers at higher price points.
The best information sources for knowledge brokers
The four sources cited here are all reputable, reliable sources of information for real estate professionals. And a closer look at the information presented by each shows they’re not really in conflict with each other. Their goal is to share accurate information that professionals in the industry can count on.
That said, we’ve all run across media headlines that present a distorted view of what’s really going on to fit a particular narrative (usually political) and get people clicking and reacting.
Byron Lazine, Tom Toole, and Lisa Chinatti weighed in on some misleading headlines in a recent episode of the Knowledge Brokers Podcast.

The mainstream media headlines can be very confusing. And when they’re talking about how much inventory is up, they’re comparing it to last spring, which was an all-time low. This is just the second all-time low on inventory. I mean, they’re both bottom of the barrel.

You’ve gotta stay positive with these people. You’ve gotta keep people moving forward and letting them know, ‘Hey, this is what the data says,’ and despite these headlines…yeah, we’re up since last year, but we’re still at the second-lowest or third-lowest or whatever the data says, and if you’re not having these conversations with consumers right now, you’re really missing the boat.

There’s so much negative news right now, and it’s our job—and everybody’s job—to put out the truth in a way that’s easy for consumers to understand and that helps them make informed and educated decisions.
Let’s take a deeper look at each of the reports below.
Fannie Mae reports a 1.0% quarterly increase and a 4.7% annual increase for Q1 2023
Fannie Mae’s Home Price Index for Q1 2023 shows a year-over-year increase at a non-seasonally-adjusted rate of 4.7%—down from a revised annual growth rate of 8.6% for the previous quarter.

It also shows a seasonally adjusted 1% quarterly increase, up from the 0.0% increase for the previous quarter. The non-seasonally-adjusted quarterly growth rate for Q1 2023 is also 1%.

As expected, the annual rate of increase in home prices has slowed dramatically in response to the rapid and significant increase in interest rates. Still, the fact that prices rose slightly in the first quarter is evidence of significant pent-up mortgage demand, despite ongoing affordability constraints. Even though mortgage rates remain elevated compared to the previous few years, the acute lack of housing supply remains supportive of home prices. Of course, the shortage of homes for sale is currently being exacerbated by the so-called ‘lock-in effect,’ which continues to disincentivize huge numbers of households with low mortgage rates from listing their homes.
For more details on the FNM-HPI, including the research methodology and the market data file for Q1 2023, check out Fannie Mae’s Research & Insights page.
Redfin reports a 3.3% annual drop in home prices for March 2023
Focusing on March, Redfin’s latest report announced a 3.3% annual decline in home prices, even as elevated mortgage rates are persuading both homeowners and potential buyers to take a step back.

That retreat, especially on the part of homeowners, further limits the flow of new listings, which fell 23.3% in March compared to a year ago, dropping to the lowest level on record except for the start of the pandemic.

The shortage of for-sale homes on the market naturally contributes to a drop in sales, preventing a downward trend in home prices and leading to more bidding wars, at least in some markets, with 44.3% of home offers submitted by Redfin agents facing competition in March.
The bidding war rate has remained close to that level for the past five months.

A larger share of sellers canceled their home-purchase agreements in March. Nearly 55,000 agreements, equal to 14.8% of for-sale homes that went under contract, fell through. That’s less than last year’s peak of 16.8% (in October) but up from 11.2% in March 2022.


This year’s spring homebuying season is lackluster. There are some signs of the typical seasonal uptick—homes are selling faster than they were in the winter—but that’s partly because there are so few new listings. Normally we see homebuyers come out in throngs at this time of year, which isn’t happening.
Median sale prices fell year-over-year in 37 of the biggest U.S. metros. The biggest annual declines were in Boise (-15.4%), Austin (-13.7%), and Sacramento (-11.9%), while Milwaukee (11.7%), El Paso (11.1%), and Omaha (10.7%) saw the biggest annual increases.

Read the full Redfin report for more details.
Sliding sales and sale prices in the NAR report
A new report by the National Association of REALTORS® shows a 2.4% monthly decline in total existing home sales for March—with sales edging lower in three out of four major U.S. regions and remaining steady in the Northeast. All four regions posted annual declines in home sales.
Total existing-home sales—completed transactions involving single-family homes, townhomes, condos, and co-ops—dropped 2.4% from February to March, resulting in a (seasonally adjusted) annual rate of 4.44 million. Year-over-year, sales declined by 22.0%, falling from 5.69 million in March 2022.

Home sales are trying to recover and are highly sensitive to changes in mortgage rates. Yet, at the same time, multiple offers on starter homes are quite common, implying more supply is needed to fully satisfy demand. It’s a unique housing market.
Total housing inventory at the end of March was up 1% month over month and up 5.4% year over year. Unsold inventory remained unchanged from February’s 2.6 month supply.
Home prices continue to rise in regions where jobs are being added and housing is relatively affordable. However, the more expensive areas of the country are adjusting to lower prices.
The median existing-home sale price for all housing types, fell 0.9% year over year. Sale prices rose slightly in three U.S. regions but fell in the West.
Read the full report for more details.
Zillow highlights home price increases and bidding wars for entry-level home shoppers
Zillow’s analysis focused on the challenges facing entry-level home shoppers in particular.
Home values rose 8% (nearly $13,000) year over year for the least expensive one-third of available homes. For context, mid-level homes gained 3% in value over the past year, while the priciest homes on the market depreciated by 1%, marking their first loss in value since 2012.

During the pandemic, the value of entry-level homes skyrocketed across the U.S. In seven of the 50 largest markets, homes at this price point gained at least 60% in value since February 2020. Tampa, Richmond, and Charlotte are the top three on that list.
Soaring mortgage rates make a bigger impact on monthly payments as home prices increase. Granted, that difference is more pronounced for homes with top-tier prices. where even a slight uptick in rates means a substantial increase in monthly costs.
The larger the margin in monthly payments between those associated with lower locked-in rates and those buyers can expect with current mortgage rates, the more likely homeowners at those price points are to stay put if they don’t need to move.
This at least partly explains why home values at the top tier are falling the fastest on an annual basis in some of the priciest markets:
- San Francisco (-14%)
- San Jose (-11%)
- Seattle (-11%).
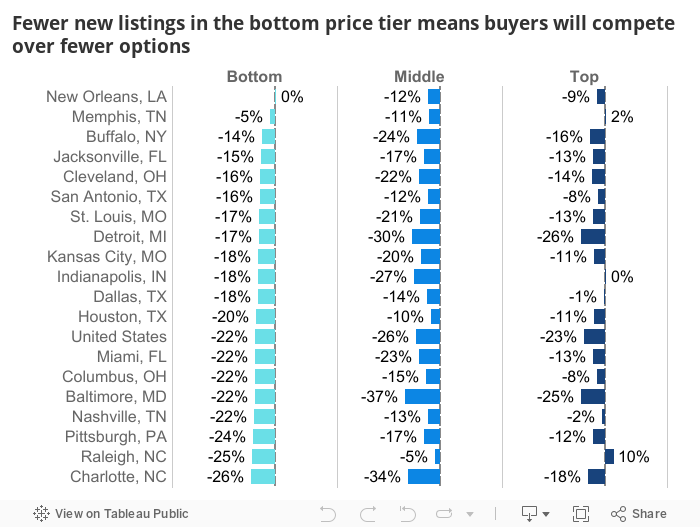
Adding insult to injury, the slight uptick in inventory has left entry-level home shoppers out in the cold, with just 1% more available homes in the lowest price tier, compared to 8% and 13% increases for the less frenetic middle and top tiers, respectively.
Thanks to the lock-in effect mentioned earlier, today’s higher mortgage rates are dissuading homeowners, especially those who don’t need to move, from selling. March brought a record-low of new listings, dropping 22% from a year ago.
That said, the impact of the rate lock is most obvious for entry-level buyers in pricey West Coast markets. In San Jose, San Francisco, Sacramento, Portland, and Seattle, bottom-tier listings in March were fewer than half the supply available a year ago.
Compared to a year ago, bottom-tier listings for San Jose, San Francisco, Sacramento, Portland and Seattle were down to fewer than half as many in March.
Throughout most of the pandemic, entry-level shoppers had an advantage over their wealthier colleagues when it came to finding discounts on home prices. The share of middle and top-tier that sold above the asking price climbed well above the bottom tier, as super-low mortgage rates ramped up demand for higher-priced homes.
But since mortgage rates peaked last fall at 7%, the share of homes that sold above asking for all three price tiers converged. And bottom-tier home shoppers are now facing a much higher probability of bidding wars for available homes.

Buyers shopping for the least-expensive homes this spring aren’t noticing much difference from the pandemic-era market heat. Competition is fierce, but there aren’t many homes for sale, so buyers should be patient but prepared to move quickly and anticipate a bidding war once they find a home they love.
Read the full report for more details.
All the more reason to go hyper-local and stay current on market data
A closer read of the Fannie Mae, Redfin and NAR market updates makes it clear one is covering a home price increase for the first quarter of 2023 while the others are focused on annual price decline for March.
Still, with one headline announcing a price drop and the other an uptick, it can be confusing for consumers. Also, even general upward and downward trends in home prices say little about what home shoppers can expect at different price points—which is where Zillow’s latest report comes in.
All the more reason to get clear on this data yourself and to share hyper-local market data with your clients and community—so they know exactly what’s happening in your area and at the price points they’re considering, even if local data deviates from national trends.
Armed with this information, they’ll have a better idea of what to expect if they start shopping for homes or list the home they have.


