


Key Details:
- According to a new Redfin report, the total value of U.S. homes increased over the past year to a record $49.6 trillion—a year-over-year increase of 6.6%.
- The number of trillion-dollar metros doubled from four to eight, with San Diego and Seattle likely to join the ranks soon if home value growth continues at the current pace.
- The total value of homes owned by Millennials rose 21.5% year over year—almost four times faster than any other generation.
- Total home values in majority Asian neighborhoods are rising faster compared to majority white, Black, or Hispanic neighborhoods.
- The total value of rural homes is growing faster than that of suburban homes.
New Redfin research shows the total value of U.S. homes rising 6.6% year over year, gaining $3.1 trillion and reaching a record $49.6 trillion as of June 2024.
Those numbers are based on an analysis of the Redfin Estimate for over 95 million U.S. homes.
Over the past decade, the total value of U.S. residential properties has more than doubled, growing nearly 120% from $22.7 trillion in June 2014.
Meanwhile, over the past year, the number of U.S. markets with total home values at $1 trillion or more doubled from four to eight, with the addition of Anaheim, Chicago, Phoenix, and Washington, D.C.

With housing supply still low compared to pre-pandemic levels, the number of buyers competing for available homes is still high enough (despite rates above 6.5%) to keep driving up home values.

The value of America’s housing market will likely cross the $50 trillion threshold in the next 12 months as there are not enough homes being listed to push prices down. Mortgage rates have started falling, but many potential sellers and buyers are waiting to make a move, meaning we are likely to continue seeing a pattern where prices slowly tick up. That’s great news for the millions of American homeowners who see their equity rising, but first-time buyers are going to keep finding it tough to find an affordable home.
New construction is another factor behind the increase in total home values. Redfin analyzed home value estimates for about 97.6 million homes—up from 96.8 million a year earlier.
New Jersey metros close to NYC posted the biggest increases in total home values
Over the past 12 months, 13 major U.S. metros reported double-digit increases in total home values, including three relatively affordable New Jersey metros within commuting distance of New York City.
Two of those metros—New Brunswick and Newark—are in the top two spots, with New Brunswick posting a 13.3% annual increase in total home values and Newark home values rising 13.2%.
Rounding out the top five are Anaheim, CA (up 12.1% year over year in June), Charleston, SC (11.8%), and New Haven, CT (+11.8%).
Data is based on Redfin’s analysis of the 100 most populous U.S. metros, specifically the 95 metros with sufficient data.
Metros with the fastest growth in total home values:
- New Brunswick, NJ (Total home value increased by 13.3% year over year in June)
- Newark, NJ (+13.2%)
- Anaheim, CA (+12.1%)
- New Haven, CT (+11.8%)
- Charleston, SC (+11.8%)
- Bridgeport, CT (+11.3%)
- San Jose, CA (+11.2%)
- Hartford, CT (+10.8%)
- Camden, NJ (+10.4%)
- Albany, NY (+10.2%)
Among metros with the slowest annual growth in total home values, Cape Coral ranks at the very bottom and stands out as the only metro posting a decline in total home value, falling 1.6%.
Most of the 10 markets in the list below are Sun Belt metros, which have grown in value more slowly compared to metros in other regions. New Orleans is at number two with an annual uptick of 0.8%, the smallest gain of all the metros included in the report.
Rounding out the bottom five are Austin, TX (up 1.9% from June 2023), North Port, FL (+2.1%), and Fort Worth, TX (+2.3%).
Metros with the slowest growth in total home values:
- Cape Coral, FL (Total home values dropped 1.6% year over year in June)
- New Orleans, LA (+0.8% total home value growth year over year)
- Austin, TX (+1.9%)
- North Port, FL (+2.1%)
- Fort Worth, TX (+2.3%)
- El Paso, TX (+2.4%)
- Honolulu, HI (+2.5%)
- McAllen, TX (+2.5%)
- Houston, TX (+2.7%)
- San Antonio, TX (+2.8%)
4 Metros Reach Trillion-Dollar Status
Four metros joined the ranks of metros with a total home value topping $1 trillion in June:
- Anaheim, CA
- Chicago, IL
- Phoenix, AZ
- Washington, D.C.
And with that, the total number of metros in the Trillion Dollar Club doubled from four to eight.
The 8 metros in the “Trillion Dollar Club”:
- New York, NY
- Los Angeles, CA
- Atlanta, GA
- Boston, MA
- Anaheim, CA
- Chicago, IL
- Washington, D.C.
- Phoenix, AZ
San Diego and Seattle appear likely to join the club in the next 12 months if home value growth in these metros continues at its current pace.
It’s also worth noting that if total home values for the entire Bay Area—San Francisco, Oakland, and San Jose—the combined housing market is worth almost $2.5 trillion.
Likewise, combining total home values for the Dallas ($734 million) and Fort Worth ($294 million) metros would also result in a total market value in excess of $1 trillion.
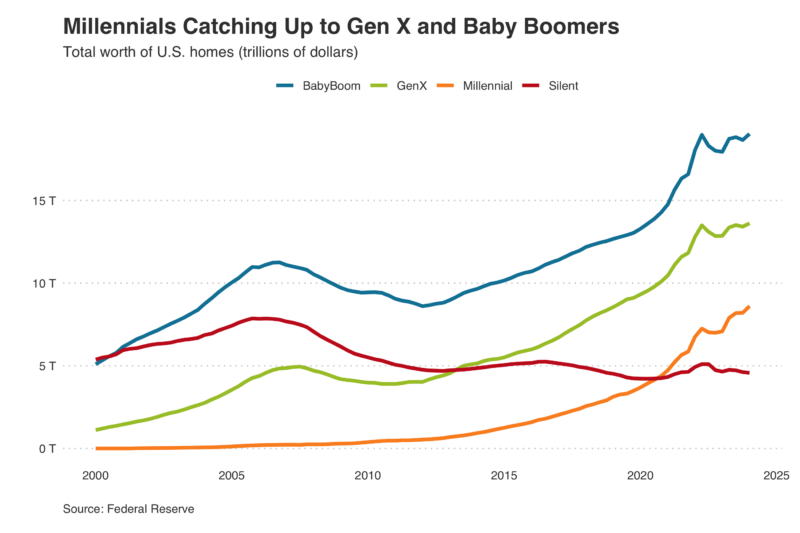
Millennials are catching up with those of Gen X & Boomers
The total value of residential properties owned by Millennials grew 21.5% year over year to $8.6 trillion in Q1 2024 (the most recent quarter for which generational data is available).
That 21.5% growth is almost four times the growth in total values for homes owned by Gen X (up 5.9% to $13.6 trillion) and Baby Boomers (up 6.1% to $19 trillion).
Total values of Silent Generation-owned homes fell for the fifth consecutive quarter, dropping 1.6% year over year to $4.6 trillion.
The increase in home values is due partly to the overall growth in home prices—but also because Millennials are now the largest generational group, and they account for a larger share of the U.S. home buying market. By comparison, fewer Gen Z have reached an age and financial position allowing them to purchase a home.
Homebuyers under the age of 45 (Millennials and Gen Z combined) account for roughly two-thirds of all the mortgage loans issued in 2023.

Rural home values are rising the fastest
The total value of urban homes increased by 6% to $10.3 trillion in June, while the value of homes in suburban neighborhoods rose 6.8% to $30.1 trillion.
Outpacing both urban and suburban homes for total value growth, rural home values climbed 7% year over year to $7.8 trillion.
Numbers for each neighborhood type:
- 57 million homes in suburban areas
- 22 million in urban areas
- 21 million in rural areas

Total home values in majority Asian neighborhoods outpaced other groups
After a drop in 2022–2023, total home values in majority Asian neighborhoods increased by 9% over the past 12 months, climbing to a total of $1.4 trillion.
That increase is due to price growth in West Coast metro areas, where many Asian neighborhoods are located.
By comparison:
- Majority white neighborhoods: total home values rose 6.6% year over year to $39.4T
- Majority Hispanic neighborhoods: total home values rose 6.4% to $2T
- Majority Black neighborhoods: total home values rose 5.4% to $1.4T

Read the full report for more information, including metro-level data and methodology.


 - BAM")


 - BAM")
