
BAM Key Details:
- Zillow analysis finds a record 242 U.S. cities now have starter homes valued at $1 million or more, up from 80 cities in February 2020 and 226 cities just one year ago.
- The typical starter home nationwide is worth $198,649, up 1.7% from a year ago, while the typical buyer now breaks even versus renting after roughly six years, down from more than eight years in late 2023.
A record 242 U.S. cities now have starter homes valued at $1 million or more, nearly triple the count from February 2020.
A new Zillow analysis finds that count has grown from just 80 cities before the pandemic, and it’s still rising, up from 226 cities just a year ago.
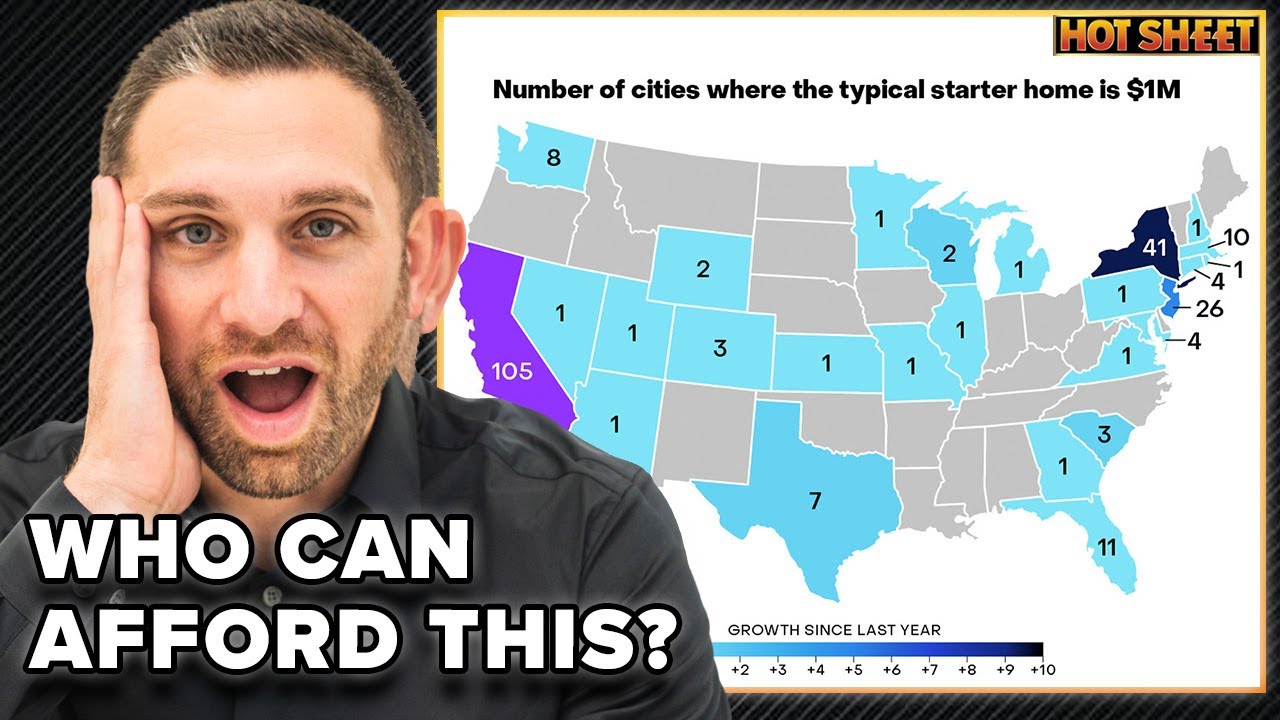
Byron Lazine broke down the data on Tuesday’s Hot Sheet:
The pandemic reset home values at a pace the market still hasn’t absorbed, and first-time buyers in high-cost cities are feeling it.
Here’s what’s driving it.
How We Got Here
A housing shortage a decade in the making collided with historic low mortgage rates and intense buyer demand, and home values reset at a pace the market still hasn’t fully recovered from.
Million-dollar starter home cities were almost entirely a coastal phenomenon before 2020. Colorado was the only interior state with a city on the list. Today, 26 states have at least one city on the list, including Texas, Wyoming, and Illinois.
Here’s where things stood before the pandemic versus today:
- National typical starter home value: $198,649, up 1.7% from a year ago
- Cities with $1M+ starter homes in February 2020: 80
- Cities with $1M+ starter homes today: 242
- States with at least one $1M+ starter home city in 2020: 9
- States with at least one $1M+ starter home city today: 26
The price reset from that era has proven durable. Buyers who were priced out five years ago haven’t gotten much relief, and in many markets, conditions have only gotten more competitive.
Home values from that era just never came back down. Buyers who were priced out five years ago haven’t gotten much relief. In many markets, conditions have only gotten more competitive.
Where It’s Hitting Hardest
Not every market is dealing with this equally. California still leads the country with 105 cities on the list, but the fastest growth is happening in the Northeast.
New York and New Jersey added 15 cities combined in the past year alone.
The top 10 states with the highest numbers of cities with $1M starter homes:
- California (105 cities)
- New York (41 cities)
- New Jersey (26 cities)
- Florida (11 cities)
- Massachusetts (10 cities)
- Washington (8 cities)
- Texas (7 cities)
- Connecticut (4 cities)
- Hawaii (4 cities)
- Maryland (4 cities)
Here’s the breakdown by major metro areas in these states:
- New York City metro (includes parts of NJ and PA): 63 cities
- San Francisco: 37 cities
- Los Angeles: 33 cities
- San Jose: 13 cities
- Miami: 8 cities
- Seattle: 8 cities
Six of the 10 most competitive housing markets in the country are in the Northeast, according to Zillow’s 2026 hottest markets analysis.
New construction has lagged there for years, and inventory deficits run deep.
Byron Lazine commented on the regional differences in new single family housing starts, based on the latest Census Bureau report:
“The Northeast is where you need homes the most (single-family). And the Northeast is down. Builders just won’t touch it. And the South, where you don’t need any more inventory, they’re still building there. Why? Because they’ve made it available to build….Sun Belt states also see the long-term trend, people moving there, the affordability is there, in comparison to other areas.”
Why Sun Belt and Northeast Are on Different Trajectories
Sun Belt markets built their way out of the worst of the pandemic affordability crunch. New construction picked up and inventory expanded. As a result, price growth slowed.
The Northeast hasn’t had that relief. Restrictive zoning has kept new construction lagging for years, and builders haven’t come close to closing the gap. Hence the reason six of the 10 most competitive housing markets in the country are concentrated in that region.
Zillow senior economist Kara Ng summed it up this way:
“Million-dollar starter homes are popping up in more Northeast cities because the housing shortage there hasn’t been solved.
“Sun Belt markets have responded with new supply and seen price growth moderate as a result. The Northeast hasn’t had that relief.
“Eliminating barriers to building like restrictive zoning is the most direct path to improvement, which is something Zillow is actively advocating for across the country.”
What Agents Need to Know for Buyer Conversations
The national headline number is $198,649 for a typical starter home, but that figure means almost nothing to a buyer in the New York City metro or the Bay Area. Local context is what connects the national narrative to what’s happening in your market.
Zillow’s data offers one piece of good news worth knowing:
- The typical buyer now breaks even versus renting after roughly six years, down from more than eight years in late 2023
Buyers weighing whether to keep renting or make a move need to hear that number from you.
Million-dollar starter homes are still the exception nationally, as Kara Ng noted:
“The pandemic reset the cost of buying a home, spreading million-dollar starter homes from a handful of coastal states to more than two dozen states across the country. But while it may feel like a market of beer tastes at champagne budgets, those million-dollar starter homes are still the exception. More inventory, slower price growth and a narrowing rent-versus-buy gap mean buyers who are financially prepared are generally in better shape than in recent years.”
If you’re working with first-time buyers in a high-cost market, put local data in context and keep the conversation moving toward a decision.
This data is most useful when you know it cold before a buyer conversation. Pull the local numbers for your market and know where your city lands on this list. Walk into every first-time buyer consultation ready to explain what the national headlines actually mean locally.
Buyers in high-cost markets are already running their own calculations on whether homeownership makes sense.
Many are looking for an agent who can walk them through the rent-versus-buy timeline in clear terms and real numbers. Is that you?