
Key Details:
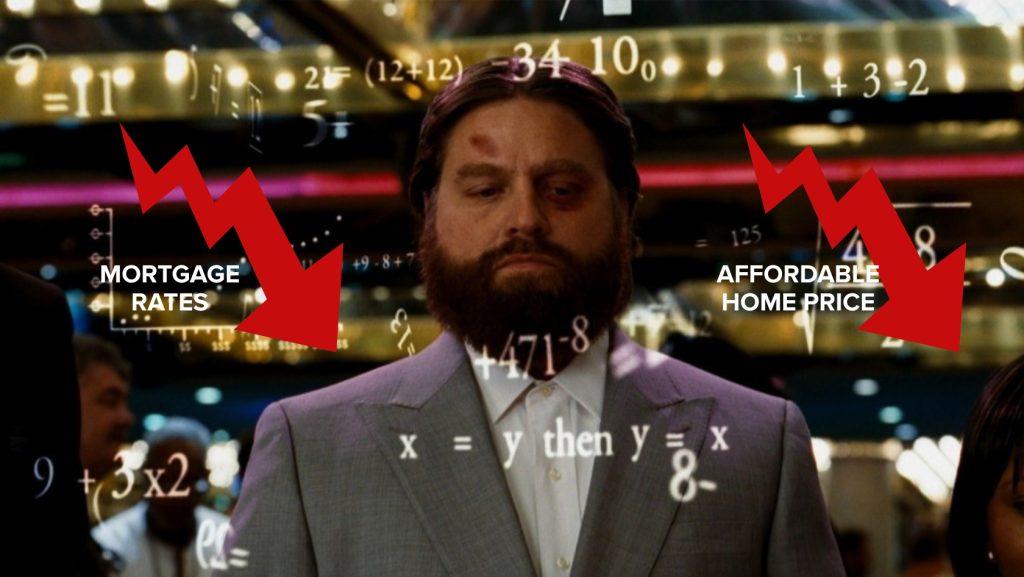
- New Realtor.com report shows the maximum affordable home price for median-income households has dropped to $298,000, down nearly $30,000 from 2019.
- With median home prices up 38% to $439,450 and mortgage rates in the 6.5%–7% range, just 28% of homes were affordable in July.
Imagine making more money than you did six years ago, yet being able to afford less. That’s today’s reality for buyers across the U.S.
According to a new Realtor.com report, wages are up 15.7% since 2019, yet the maximum affordable home price for a median-income household has actually fallen to $298,000, almost $30,000 less than in 2019.
Meanwhile, the median home price has surged to $439,450.
That double whammy of reducing buying power and higher prices is why only 28% of homes for sale were affordable for the typical U.S. household in July.
That said, some markets have actually seen improvements in buying power.
Read on for the details.
The Mortgage Rate Math
The heart of the affordability crunch is how much higher mortgage rates eat into a monthly budget. In 2019, rates sat between 3.5% and 4.5%. Today, they’re holding steady in the 6.5% to 7% range.
Take a $400,000 home as an example:
- At a 4% rate, the monthly principal and interest payment (20% down) would be about $1,500.
- At 6.75%, the monthly payment jumps to $2,100.
- That’s $600 more per month or $7,200 more per year, just in financing costs.
While incomes have risen from $68,000 in 2019 to $79,000 today, that extra $11,000 only raises the recommended housing budget by about $300 per month.
That doesn’t come close to offsetting the increased borrowing costs.
The Price Problem
Mortgage rates aren’t the only factor at play. Home prices have soared nearly 38% since 2019, climbing from $319,450 to $439,450. Even though household incomes are higher, buyers’ affordable price threshold has fallen from $325,000 in 2019 to just $298,000 today.
This double squeeze of higher borrowing costs and higher home prices has fundamentally changed the affordability equation.
Where Buying Power Has Fallen the Most
Some metros have taken a harder hit than others. According to the report, buying power dropped the most in Milwaukee, Houston, Baltimore, New York City, and Kansas City, where weaker wage growth worsened affordability.
- Milwaukee, WI: Max affordable price fell from $314,000 to $281,000 (a 10.5% drop). Just 28.3% of homes were affordable in July, compared with 58.2% in 2019.
- Houston, TX: Dropped from $330,000 to $299,000 (-9.4%). Affordable share fell from 59.2% to 32.4%.
- Baltimore, MD: Fell from $397,000 to $360,000 (-9.3%). Affordable share slid from 63.1% to 42.7%.
- New York City, NY-NJ: Fell from $397,000 to $360,000 (-9.3%). Only 13.1% of homes were affordable in July, down from 28.2% in 2019.
Other metros like Kansas City also saw steep declines, though most still had above-average affordable inventory.
New York was the exception, with affordability dropping below the national average.
Where Buying Power Has Improved
Not every metro is in the red. Six markets actually saw buying power improve thanks to stronger wage growth. The biggest winner was Cleveland, which saw a 4.4% increase in its affordable home price.
- Cleveland, OH: Max affordable price rose from $249,000 to $260,000. Even with the gain, the share of affordable inventory slipped from 65.4% to 50%.
- Phoenix, AZ: Rose from $324,000 to $332,000 (+2.5%), though just 13.7% of homes were affordable in July.
- Richmond, VA: Edged up from $326,000 to $331,000 (+1.5%).
- Indianapolis, IN: Improved slightly from $298,000 to $302,000 (+1.3%).
Tampa and Austin also saw slight bumps, but like Phoenix, most of their inventory remains out of reach for median-income households.
Why It Matters
Shrinking buying power forces buyers to make tough choices: purchasing smaller homes, accepting longer commutes, or delaying their move altogether.
For sellers, that shift means listings sit longer and often require price adjustments to attract offers. As Jones put it:
“Shrinking buying power pushes buyers toward buying smaller homes, opting for longer commutes, or delaying home purchases altogether.”
Meanwhile, limited affordable inventory is intensifying competition for lower-priced homes, pushing more would-be buyers into the rental market.
With builders pivoting away from multifamily construction, even that relief may not last.
Takeaways for Real Estate Professionals
For agents, this data is more than market trivia. It’s a communication tool. Clients want to know why their budgets feel tighter, and reports like this help put numbers to the frustration.
Here are three ways to use it:
- Set realistic expectations: Share how rate-driven affordability has shifted since 2019 so buyers understand what they can afford today compared with a few years ago.
- Highlight local market differences: Use national and metro-level data to explain why some cities have it worse (or slightly better) than others.
- Reframe affordability conversations: Show clients the trade-offs, whether that’s considering smaller homes, adjusting neighborhoods, or planning for a longer timeline.
The bottom line: elevated rates and rising prices have reshaped affordability across the U.S. Until mortgage rates dip or supply meaningfully expands, many buyers will be stretching their budgets further, or waiting on the sidelines.
For agents, being the professional who can explain the “why” behind those shifts is a value-add clients won’t forget.