
Key Details:
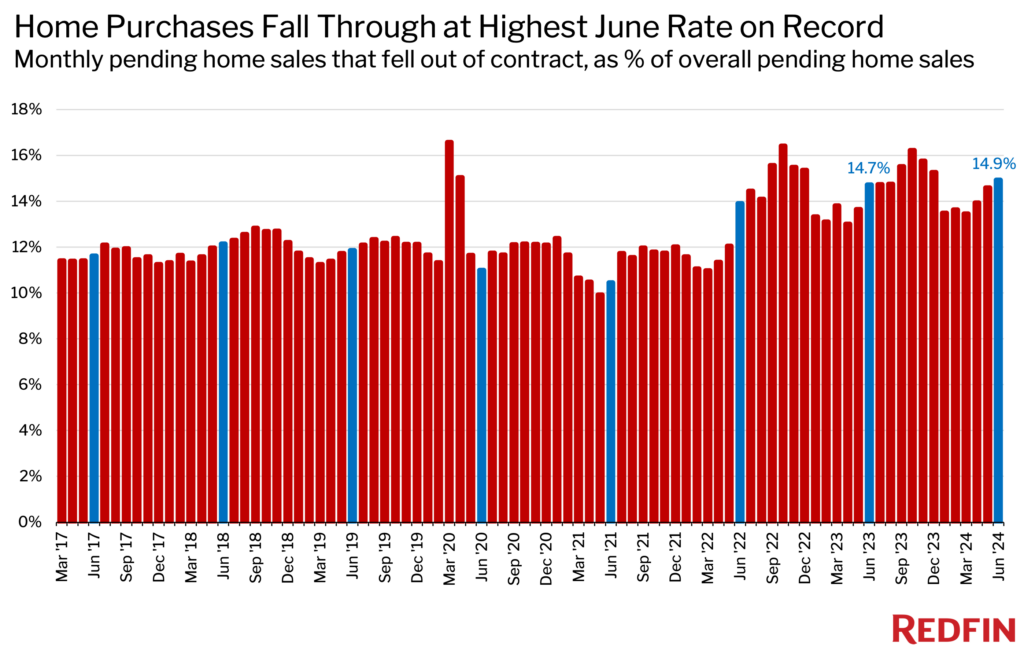
- A new Redfin report shows nearly 56,000 home purchase agreements fell through in June, accounting for 14.9% of the homes that went under contract—the highest share of any June on record since 2017.
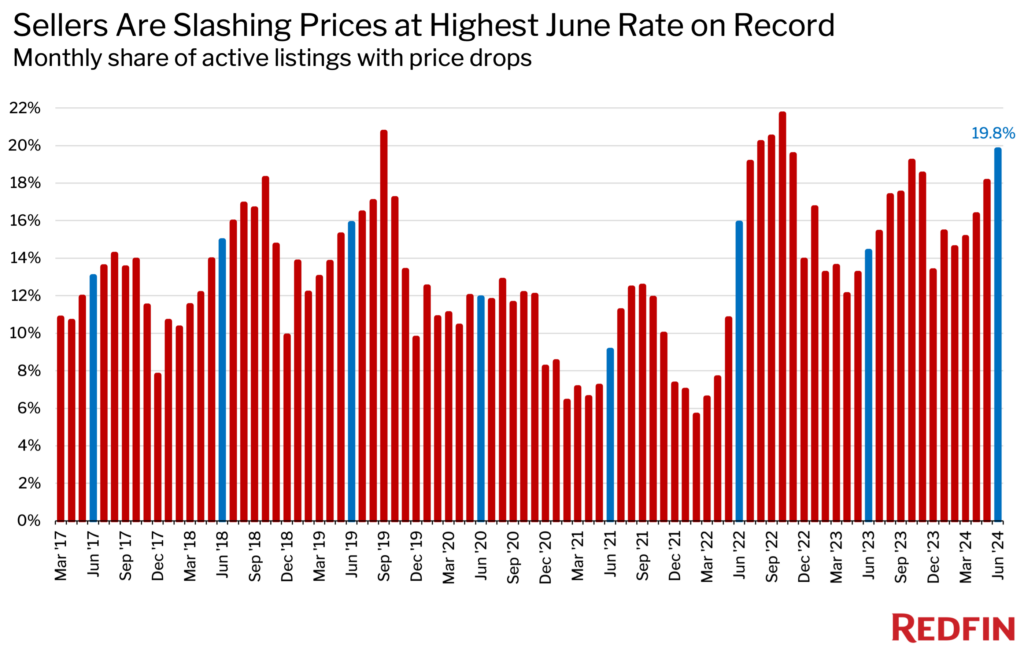
- Nearly one in five (19.8%) of the homes for sale in June had a price cut—up from 14.4% a year ago and just under the 21.7% record set in October 2022. It’s also the highest share of any June on record.
In June 2024, would-be homebuyers backed out of nearly 56,000 home purchase agreements, accounting for 14.9% of the homes that went under contract.
According to the Redfin report supplying this data, that’s the highest share of any June on record since 2017.
Also in record numbers for June, 19.8% of the homes for sale that month had a price cut—up from 14.4% in June 2023 and a little below the 21.7% record set in October 2022.
Homebuyers are backing out of more deals because the cost of buying a home is higher than ever. While mortgage rates have dipped below 7% (at least temporarily), they’re still more than twice pandemic-era lows.
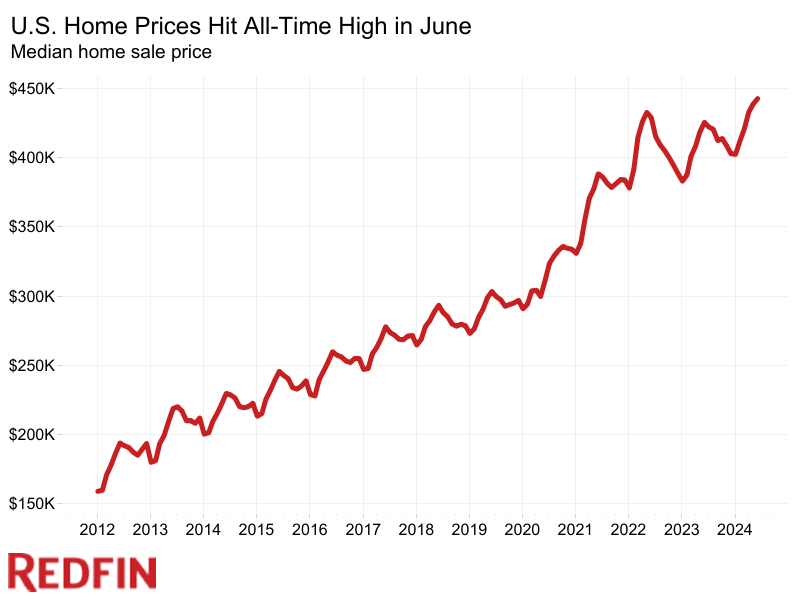
Meanwhile, the median home sale price in June was up 4% year over year, climbing to a record $442,525.
Homebuyers are backing out of more home purchase agreements this June over minor issues because the high cost of buying a home makes them less likely to overlook shortcomings that will ultimately add to their homeownership costs, making it even harder to pay the bills each month.
Many took a step back once they learned what they’d be paying for costs over and above their mortgage payments, including—
Florida metros lead the U.S. in home purchase agreement cancellations
Of the five metros with the highest cancellation rates in June, the top three were in Florida:
- Orlando (20.8% cancellation rate)
- Jacksonville (20.5%)
- Tampa (20.5%)
- Las Vegas (20.2%)
- San Antonio (19.9%)
Miami is next in line with roughly 2,500 home purchase cancellations, amounting to 17.6% of the homes that went under contract.
One factor in the higher rate of home purchase cancellations is Florida’s new laws requiring owners of condo buildings more than 30 years old to build reserve funds and submit to structural inspections, adding both legal complexities and costs for homebuyers.
Record High Price Drops
Nearly one in five (19.8%) of the homes for sale in June had a price cut, marking the highest share for any June on record—up from 14.4% one year ago.
Days on market are also up, with the typical home sitting on the market an average of 32 days, the longest period for any June since 2020.
Home sales fell 0.5% month-over-month in June, marking the biggest decline since October 2023. Sales were down 1.1% year over year and down 21.5% compared to June 2019 pre-pandemic levels.
Many buyers are waiting on the sidelines, hoping for further declines in mortgage rates, which are unlikely to drop significantly by the end of this year.
Metro-level highlights for June, 2024
Median home sale prices
Metros with the biggest annual increases in median home sale prices:
- Anaheim, CA (13.2%)
- Newark, NJ (12.6%)
- Nassau County, NY (12%)
Metros with the biggest annual declines in median sale prices (all of which are in Texas):
- Austin (-5.5%)
- Dallas (-1.6%)
- San Antonio (-1.3%)
- Fort Worth (-0.2%)
Price Cuts
Metros with the highest shares of listings with price drops:
- Indianapolis (49.2%)
- Denver (46.6%)
- Tampa (43%)
Metros with the lowest shares were in—
- Newark (15.2%)
- Chicago (16.3%)
- Milwaukee (17%)
Active Listings
Metros with the largest increases in active listings:
- Tampa (47%)
- Fort Lauderdale, FL (45.3%)
- Orlando (41.4%)
Metros with the largest declines in active listings:
- Chicago (-7.4%)
- New Brunswick, NJ (-7%)
- Chicago (-7.3%)
- New York (-5.8%)
Home Sales
Home sales increased in only one metro: San Jose, CA (1.8%). They declined the least in—
- Portland, OR (-3.2%)
- Oakland, CA (-3.7%)
- San Diego (-5%)
Home sales fell the most in—
- West Palm Beach, FL (-23.5%)
- Fort Lauderdale (-23%)
- Virginia Beach, VA (-17.7%)
Sales above the final list price
Metros with the highest shares of homes selling above their final list price:
- San Jose, 72.1%
- Newark (71.7%)
- Oakland (63.1%)
Metros with the lowest shares of homes selling above their final list price:
- West Palm Beach (7.3%)
- Miami (11.4%)
- Fort Lauderdale (12.3%)
See the full report for more information, including methodology.