


BAM Key Details:
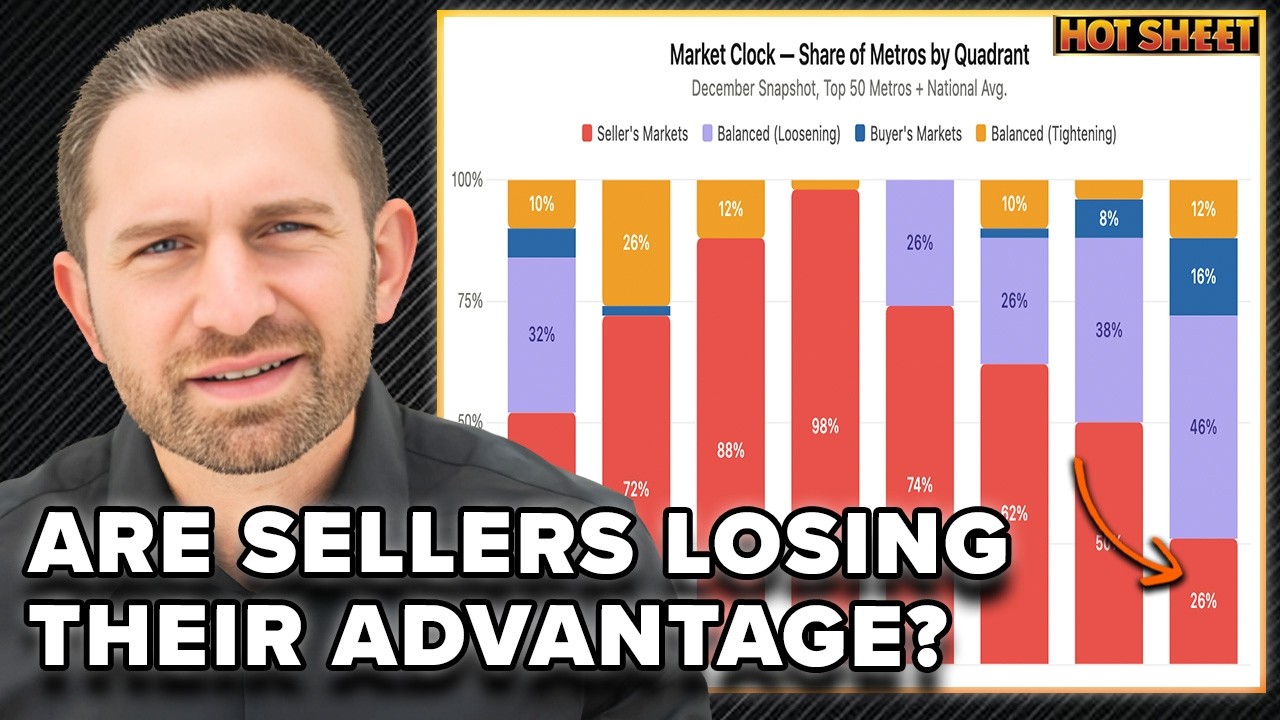
- Realtor.com reports 26% of the top 50 metros remain seller’s markets, down from 98% in 2021, while 46% are now balanced and 16% have shifted to buyer-friendly conditions.
- Across all markets, 8 metros are classified as buyer’s markets, 13 remain seller’s markets, and 6 are already tightening back toward sellers.
Just 26% of the largest U.S. housing markets are still seller’s markets.
A few years ago, nearly every major metro leaned heavily toward sellers. Conditions today look very different. And while regional trends are still a thing, each metro has trends of its own.
Realtor.com’s new Market Clock puts structure around those changes. It shows where leverage sits right now and how quickly conditions are evolving across different markets.
As you know by now, national news headlines can quickly cause confusion for consumers, especially at the local level. Doomer narratives get clicks, but they don’t build trust.
Realtor.com’s report gives you a way to explain what’s happening in plain terms, based on what’s actually playing out nationwide and in the largest U.S. metros.
Byron Lazine broke down the data on today’s Hot Sheet.
The Market Has Moved Off Peak Seller Conditions
The easiest way to understand what’s happening right now is to zoom out for a second.
What we’re seeing is the result of a market that’s been unwinding from one of the most extreme seller environments we’ve ever seen.
Back in 2021, almost every major market in the country was tilted heavily toward sellers. The data shows how those conditions have eased over time.
Here’s how the cycle has played out:
- 2019 saw 72% of the top 50 metros in seller-leaning territory, with another 26% already moving in that direction
- 2021 pushed that even further, with 98% of metros in full seller-market conditions and only one market outside that category
- 2023 still had 62% of metros in seller territory, even after higher mortgage rates slowed demand
- 2025 marked a clear turning point, with seller markets dropping to 26%, buyer markets rising to 16%, and balanced-loosening markets taking the lead at 46%
Nearly half of the biggest markets in the country now sit in the middle. And they’re moving toward buyer-friendly conditions.
Local Markets Are Splitting in Different Directions
The national number gives you a headline, but it doesn’t tell you what’s actually happening on the ground. Here’s where the report gets useful.
Across the 50 largest metros, conditions now cover nearly the entire spectrum of the Market Clock. When you take a step back, you’re looking at dozens of different versions of it.
Here’s how those markets break down right now:
- 13 metros, or 26%, are still seller’s markets
- 23 metros, or 46%, are in balanced-loosening conditions
- 8 metros, or 16%, are already buyer’s markets
- 6 metros, or 12%, are in balanced-tightening conditions and moving back toward sellers
Some markets are clearly cooling. Some are holding steady. A few are gaining strength again.
A buyer in Houston is dealing with a very different set of conditions from a buyer in Hartford. The same goes for sellers trying to price a home or negotiate terms.
When you understand where your market sits and have local data to back it up, you have an opportunity to bring clarity to buyers and sellers in your market.
Where Buyers Have Gained the Upper Hand
There are currently 8 metros that qualify as buyer’s markets. The majority are in the South, with one in the West.
- Atlanta–Sandy Springs–Roswell, GA
- Austin–Round Rock, TX
- Jacksonville, FL
- Miami–Fort Lauderdale–West Palm Beach, FL
- Nashville–Davidson–Murfreesboro–Franklin, TN
- Orlando–Kissimmee–Sanford, FL
- Tampa–St. Petersburg–Clearwater, FL
- Riverside–San Bernardino–Ontario, CA
These markets are all classified as “Early Buyer,” which matters because it tells you where things are headed, not just where they are today.
In these metros, you’re starting to see:
- Inventory levels increasing
- Price reductions becoming more common
- Buyers gaining negotiating leverage
- Sellers adjusting expectations
Buyers in these markets are moving with more confidence. They’re taking more time and negotiating more directly. They’re also asking for concessions and, in more cases, getting them.
What does that mean for agents? For one, pricing strategy becomes more sensitive. Seller expectations need to be reset earlier.
For another, buyers need guidance on how to take advantage of the leverage in front of them without overplaying it.
Where Sellers Still Hold Power and Where It’s Tightening Again
Seller leverage is concentrated in fewer markets. Those markets are mostly in the Midwest and Northeast.
There are currently 13 metros that qualify as seller’s markets. Here’s the breakdown by phases on the Market Clock.
Clock Hour 11 (Early Seller):
- Grand Rapids-Wyoming, MI
- Kansas City, MO-KS
- Milwaukee-Waukesha-West Allis, WI
- St. Louis, MO-IL
- Providence-Warwick, RI-MA
- San Francisco-Oakland-Hayward, CA
Clock Hour 12 (Peak Seller):
- Chicago-Naperville-Elgin, IL-IN-WI
- Indianapolis-Carmel-Anderson, IN
- Hartford-West Hartford-East Hartford, CT
- Virginia Beach-Norfolk-Newport News, VA-NC
Clock Hour: 1:00 (Late Seller):
- Columbus, OH
- Boston, MA
- San Jose, CA
Six metros sit in balanced-tightening conditions, which means they’re moving back toward seller advantage.
- Minneapolis and New York are in balanced-warming phases
- Buffalo, Pittsburgh, Portland (Oregon), and Seattle are in late balanced phases
In these markets, homes are moving with more urgency. Buyers have less room to negotiate. Pricing holds up more consistently.
Leverage still exists. It’s just concentrated, and in some cases, building again.
The biggest takeaway is how uneven the market has become. There’s no single “U.S. housing market” right now. There are dozens of local markets, each sitting at a different point on the clock.
The agents who understand where their market sits and where it’s headed will be the ones clients turn to for clear, grounded guidance.


 - BAM")


