


Property taxes hit $396.8 billion across the U.S. in 2025. The average tax bill climbed to $4,427, up 3% from 2024.
At the same time, home values slipped 1.7% to $494,231, pushing the national effective tax rate up to 0.9% from 0.86% in 2024, the highest level since 2020.
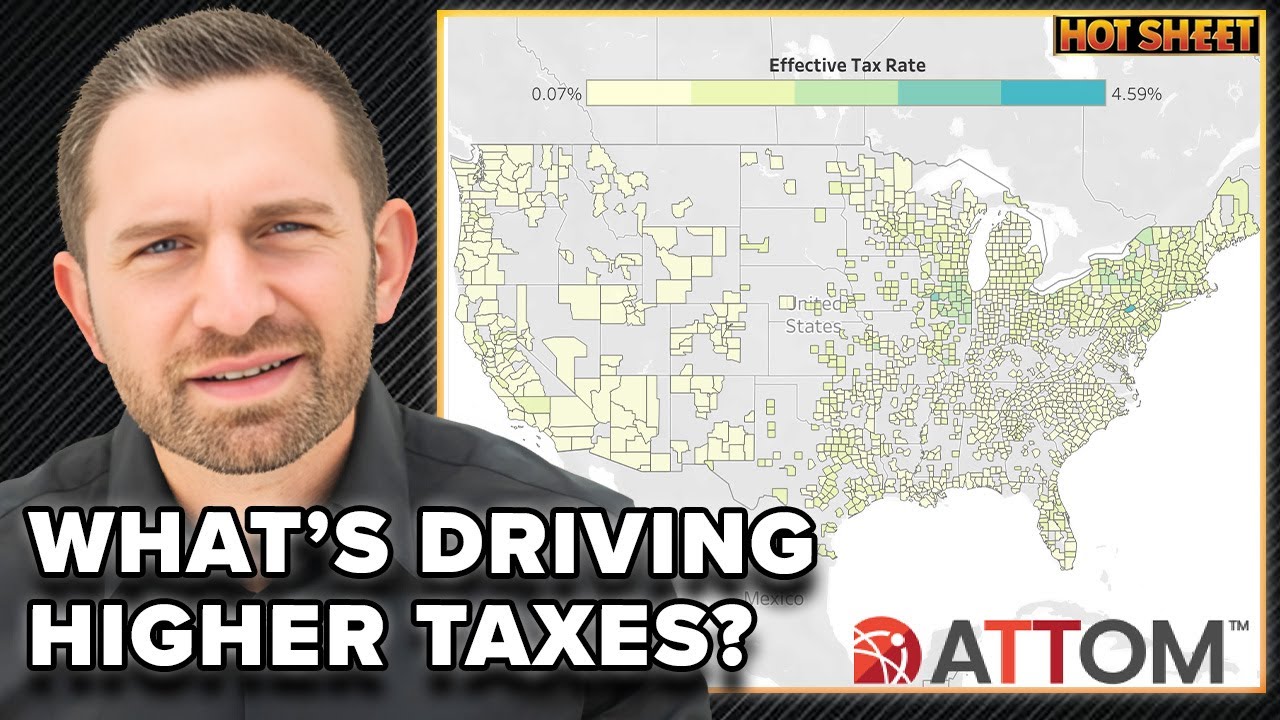
The latest data from ATTOM’s 2025 Property Tax Analysis shows how fast property tax costs are climbing, and which regions have the highest growth rates.
Higher local costs are showing up directly in rising tax bills, and homeowners are feeling it in their monthly costs.
And those higher tax bills are starting to influence buying decisions.
Byron Lazine unpacked the data on today’s Hot Sheet:
Regional Disparities Across States
In the report, ATTOM CEO Rob Barber stated,
“Property taxes in 2025 demonstrate that tax bills reflect more than just home values. Even with a slight dip in prices, higher tax bills combined with declining home values led to an increase in effective tax rates, underscoring the role of local government costs and shifting tax policies. Regional disparities persist, with the Northeast and Midwest continuing to see the highest burdens.”
It comes as no surprise that where you live still plays a major role in how much you pay in property taxes. States in the Northeast and Midwest continue to carry the highest effective tax rates, led by:
- Illinois: 1.84%
- New Jersey: 1.58%
- Vermont: 1.4%
- Connecticut: 1.36%
- Ohio: 1.32%
Those higher rates translate directly into higher bills, with the highest averages in:
- New Jersey: $10,499
- Connecticut: $8,901
- New Hampshire: $8,174
- Massachusetts: $7,904
- New York: $7,732
In other parts of the country, the numbers look very different. The lowest effective tax rates were reported in:
- Hawaii: 0.33%
- Idaho: 0.39%
- Wyoming: 0.4%
- Arizona: 0.43%
- Alabama: 0.43%
You can see the difference clearly in what homeowners actually pay. The lowest average tax bills were:
- West Virginia: $1,081
- Alabama: $1,284
- Arkansas: $1,387
- Mississippi: $1,563
- Louisiana: $1,639
The spread between states is still wide, and it plays a big role in affordability depending on where buyers land.
Local Market Trends and Tax Growth Hotspots
Property taxes are rising in many local markets, with 50.2% of metro areas seeing increases above the 3% national average. Some of the highest effective tax rates are concentrated in smaller metros across the Northeast and Midwest, including:
- Binghamton, NY: 2.27%
- Champaign, IL: 1.95%
- Trenton, NJ: 1.89%
- Peoria, IL: 1.88%
- Rockford, IL: 1.86%
On the other end of the spectrum, the lowest tax rates are showing up in markets like:
- Knoxville, TN: 0.29%
- Salisbury, MD: 0.29%
- Honolulu, HI: 0.33%
- Johnson City, TN: 0.34%
- Lake Havasu City, AZ: 0.34%
Some of the biggest jumps in tax bills are happening in larger metros. Among those with populations over 1 million, the largest increases were:
- Memphis, TN: up 34%
- Baltimore, MD: up 27%
- St. Louis, MO: up 11%
- Houston, TX: up 10%
- Kansas City, MO: up 8%
At the county level, high tax bills are heavily concentrated in a few states. A total of 26 counties reported average tax bills over $10,000, with:
- 10 in New Jersey
- 5 in California
- 3 in New York
The highest average tax bills were recorded in:
- Westchester County, NY: $18,386
- Marin County, CA: $16,745
- Bergen County, NJ: $14,443
- Essex County, NJ: $14,337
- San Mateo County, CA: $14,312
These local trends show how much tax burdens can vary from one market to another, even within the same state.
What This Means for Buyers and Homeowners
Property taxes are taking up a larger share of the cost of owning a home. Higher tax bills can push monthly payments higher, even when home prices are flat or declining.
In some markets, those increases are large enough to change what buyers can afford. A higher annual tax bill can limit purchasing power or shift demand toward lower-cost areas.
For current homeowners, rising taxes can add pressure over time. Even small yearly increases can build into a meaningful jump in housing costs, especially when the prices of so many other necessities keep climbing.
When taxes climb high enough, it starts to shape where people buy and what they’re willing to pay.


 - BAM")


