Key Details:
- According to the Knock Buyer Seller Market Index report, continuing shifts in the U.S. housing market will increase the number of buyers’ markets from 13 to 34 by the end of 2023.
- Buyers who are flexible on when and where they buy a home stand the best chance at finding and purchasing a home they can afford in 2023.
According to the Knock Buyer Seller Market Index report, continuing shifts in the U.S. housing market will increase the number of buyers’ markets from 13 to 34 by the end of 2023.
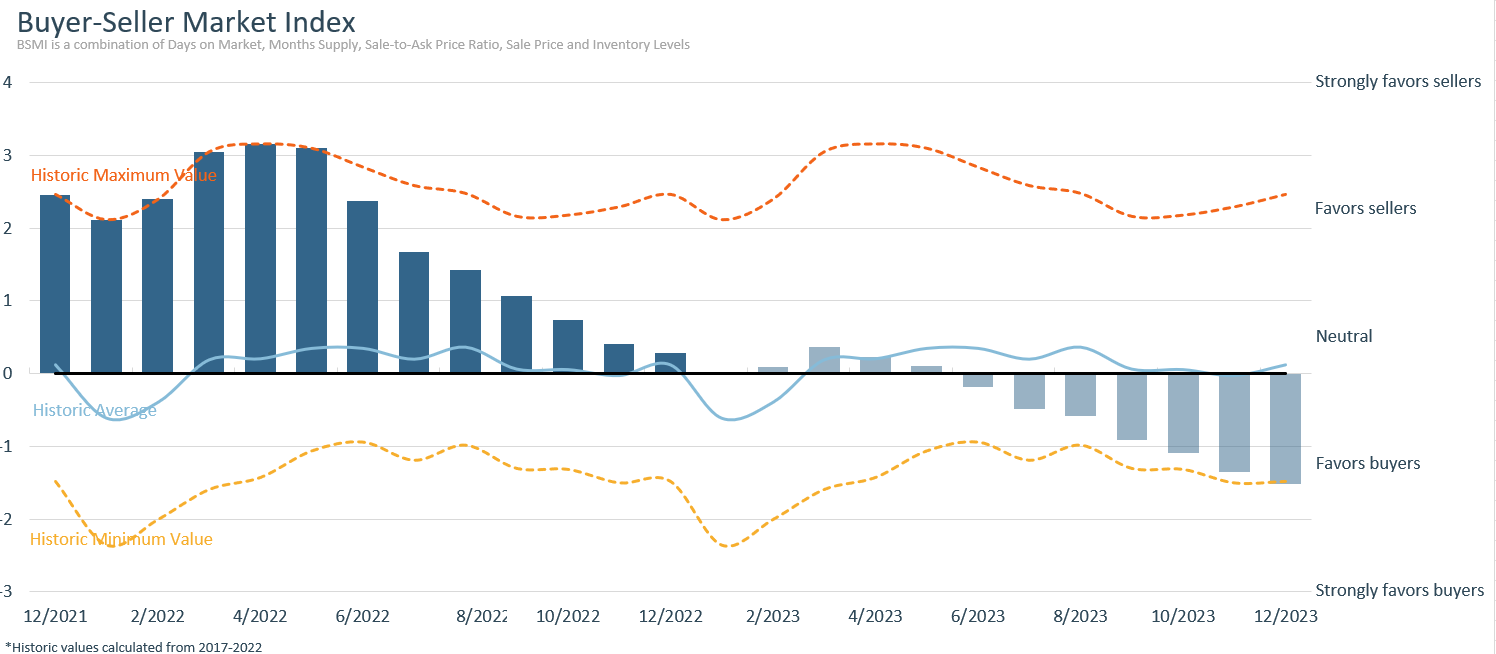
It’s still early days in 2023, and going by the latest data from the Knock Buyer-Seller Market Index, 44 of the 100 largest housing markets favored (or strongly favored) sellers, 44 were neutral, and 13 favored buyers.
That’s actually good news for buyers. A year ago, all 100 of those markets favored sellers.
But over the past 12 months, the slowdown in home sales and home price growth have been shifting the market in buyers’ favor.
So, with that in mind, and using data from the Knock index, here are the 10 best markets for buying a home in 2023.
More flexibility, more options
So far, the year 2023 is offering buyers a calmer housing market with more bargaining power and more time to consider their options.
But mortgage rates are still high enough to deter homeowners with sub 3% mortgage rates from selling. And 50 of the 100 largest U.S. markets are expected to see declines in inventory.
The upshot is buyers will have fewer housing options to choose from. And because of that, home shoppers who are flexible in terms of when and where they buy have a better chance of finding an affordable home they love.
According to the Knock Buyer-Seller Market Index, which measures the degree to which each of the 100 largest markets favors home buyers or sellers, based on key housing market metrics, the market has shifted over the past 12 months to change the number of markets favoring buyers from zero to 13. And by the end of 2023, that number is expected to reach 34.
The index uses the following six equally-weighted housing metrics, each representing six years of monthly data, to analyze each market:
- Average sale-to-ask price ratio—Average calculation of the ratio of final home sale price to asking price.
- Number of Homes Sold
- Inventory—Number of active listings
- Median Days on Market—Median number of days between a property’s listing date and the day it’s removed from the market (when it goes pending). This data is not available for seven of the 100 largest markets: Boise, ID; Richmond, VA; Seattle, WA; Allentown, PA; Portland, ME; New Haven, CT; and Bridgeport, CT)
- Median Sale Price—Middle of the home sale price distribution
- Months’ Supply—Calculation: number of active listings / months’ supply using a six-month moving average inventory estimate as the denominator (starting June 2017)
Overall, despite a slight uptick in home prices (+0.7%) from December 2021, homes sold at or below the asking price in all but six of the 100 largest markets:
- Buffalo, NY
- Hartford, CT
- New Haven, CT
- Rochester, NY
- Springfield, MA
- Syracuse, NY
Median days on market rose to 29—a full two weeks more than a year ago. And at the end of 2022, active inventory stood at 354,000 homes for sale, 32.1% more than a year ago, primarily due to a drop in home sales, not an increase in new listings.
Judging by the Index forecast, the number of for-sale homes is expected to continue growing through 2023, increasing by 17% by the end of the year.

We expect 2023 to bring more balance to the housing market, which is certainly good news for buyers following three years of intense competition. At the same time, with inventory down nearly 42% from the start of the pandemic and no real incentive for sellers to move, finding a home you both like and can afford will remain a challenge. Those buyers with flexibility on where and when to move have an opportunity to find more homes for sale in some of the nation’s largest and most desirable housing markets beginning in the fall.
The top buyer and seller markets in 2022
All but one of the 100 largest markets—Fayetteville, North Carolina—moved at least a smidge toward favoring buyers during 2022. With the typical home in Fayetteville spending just 10 days on the market, and with just half a month of housing supply (both among the lowest for these measures), this metro is holding its place as the nation’s number one market for sellers.
Phoenix, on the other hand, shifted more dramatically in the direction of buyers than any other market in 2022 and held onto its reign as the number one buyers’ market in December, when the typical Phoenix home sold for 3% under the asking price.
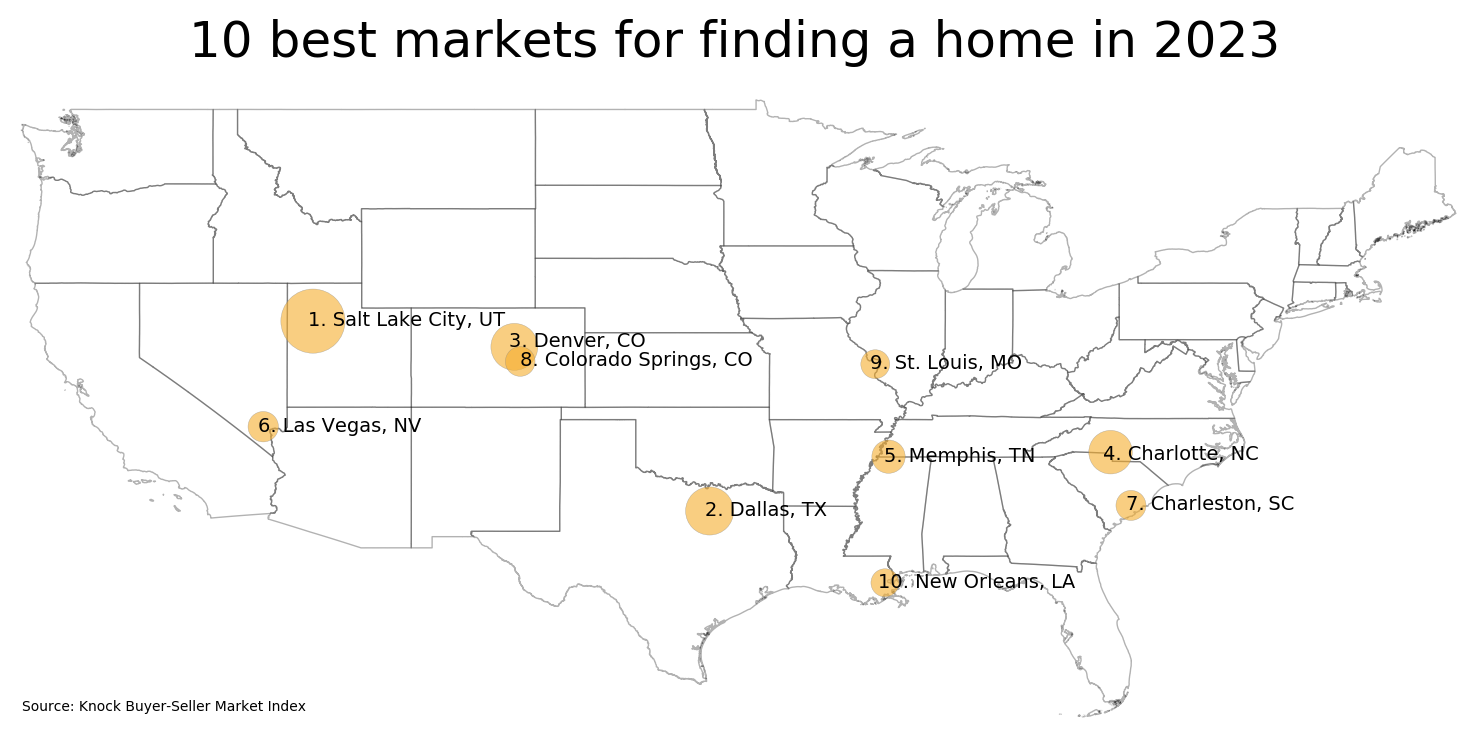
The top 10 markets for buying a home in 2023
Here are the ten best markets for buying a home in 2023, based on those six key housing market metrics:
- Salt Lake City, UT
- Dallas–Fort Worth–Arlington, TX
- Denver–Aurora–Lakewood, CO
- Charlotte–Concord–Gastonia, NC-SC
- Memphis, TN-MS-AR
- Las Vegas–Henderson–Paradise, NV
- Charleston–North Charleston, SC
- Colorado Springs, CO
- St. Louis, MO
- New Orleans–Metairie, LA
What to expect this year: seasonal shifts in key housing metrics
Based on seasonal trends and data for the Knock Index, home buyers are expected to return to the market in greater numbers this spring, creating a window of opportunity for sellers.
Seasonal patterns typically bring an increase in buyer activity in the spring, and with what we’ve seen in January, the market is likely to shift in sellers’ favor in the months ahead before moving decisively in favor of buyers by summer and staying in that direction for the rest of 2023.
By year-end, 34 of 100 markets are expected to be buyers’ markets—up from last December’s 13—while 34 will remain sellers’ markets (down from 44) and 32 will be neutral.
Meanwhile, the shortfall in inventory will keep home prices from falling to any significant degree. Only 16 of the 100 largest markets are likely to see any declines in home prices.
In fact, median sale prices are likely to increase at least 10% in 20 markets over the same time period. The forecast calls for a peak in home prices at $366,000 by June 2023, well below the record-breaking peak of $410,000 set last April, May, and June.
By December, according to the forecast, the median home sale price will decline 4% year over year to $351,000.
Home sales are also expected to drop by 10.5% year over year, with the number declining in 75 markets. And the typical home will spend a median 52 days on market by year-end—the longest time on market since January 2017.
Days on market for Raleigh, NC and Greeley, CO are expected to lead all other markets at 130 and 104 days, respectively.
The sale-to-asking price ratio is forecast to hold at between 2-3% below list price through the spring before declining in August and ending the year down 4%, the lowest ratio since January 2017, the first month of Knock’s Buyer-Seller Market Index.
Top takeaways for real estate agents
The Knock Buyer-Seller Market Index should be part of your resource folder when educating your clients, prospects, and community on changes in your local market, as well as national market trends.
The information here is something you can share to further illustrate the unique buying opportunity in today’s market. Buyers and homeowners in your area are likely to be interested in which markets favor buyers and which are still heavily in sellers’ market territory.
Keep them in the loop as the market shifts in favor of buyers (more in some than others), and help both buyers and sellers make the most of their advantages—not just to make a sale but to set them up for success.