
While rents across the country are cooling off, New York City is doing its own thing—again.
According to the latest rental report from Realtor.com, rents across the country have been declining for a year and a half. Yet NYC’s median asking rent is up nearly 7% compared to the same time last year.
With affordability already stretched thin, this raises big questions for renters, landlords, and real estate professionals alike.
Meanwhile, renter competition for more affordable NYC apartments is on another level.
Apartment Hunting in NYC
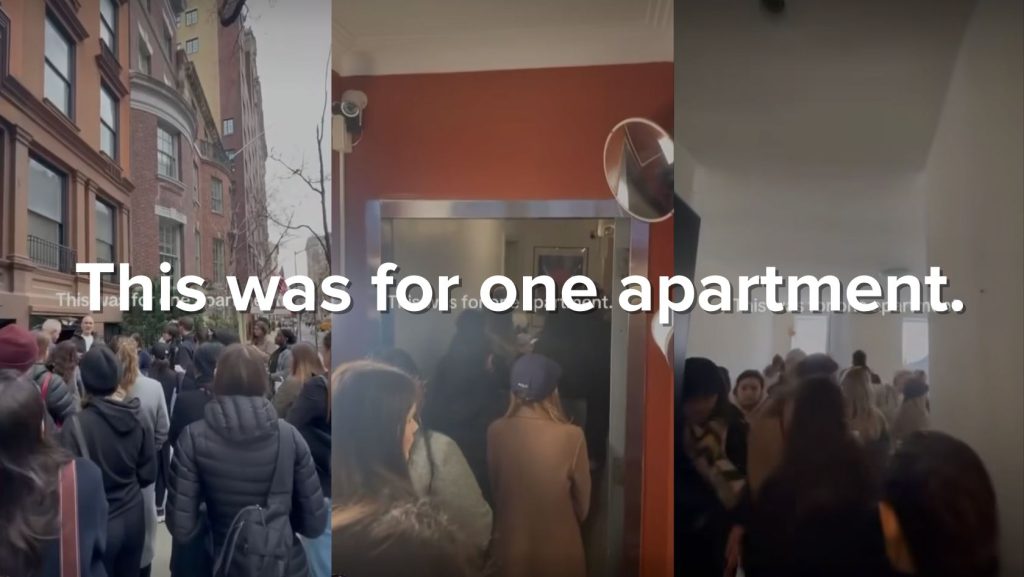
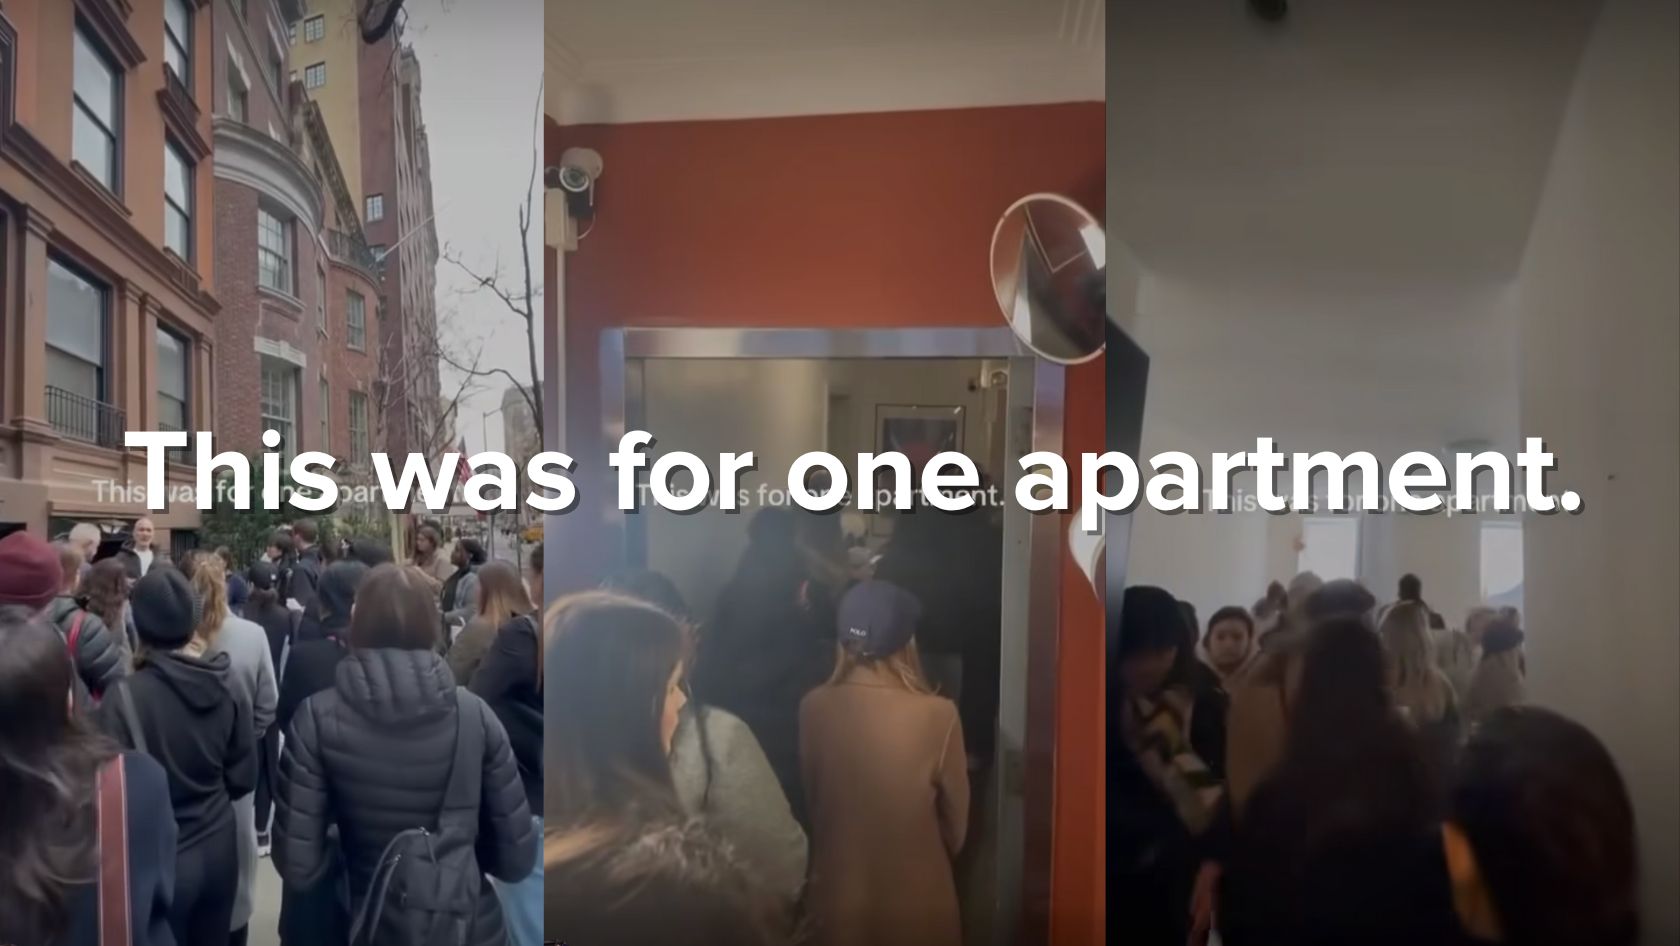
NYC Realtor Josh Rubin — a recent guest on the Knowledge Brokers Podcast — posted a haunting visual on Facebook of renters lined up for a single NYC apartment. The line goes down the hallway, out the door, and down the street.
Rubin’s caption:
“This is what apartment hunting looks like in NYC. Rents just hit another new record high—Manhattan’s median rent is now $4,500, up 6.4% from last year, with over 25% of leases ending in bidding wars. Brooklyn isn’t far behind with a $3,600 median rent and an even crazier 35% of new leases getting bid up (data according to brokerage firm Douglas Elliman).
“Finding an affordable apartment here is starting to feel like winning the lottery.”
Oddly enough, while competition for some apartments is intense, rentals in key NYC boroughs are spending significantly more time on the market compared to a year ago. Manhattan rentals are spending a median of 51 days on market—up 104% year over year.
What does that mean for you? Even if your market is miles away (literally and figuratively), data from Realtor.com’s latest rental report is valuable intel that can help you—
- Understand broader market trends
- Spot opportunities for clients planning to relocate
- Track investor buying strategies (in response to market shifts)
- Gauge supply and demand dynamics
- Sharpen your market expertise
- Stay ahead of policy and regulatory changes
With that in mind, read on for the highlights from Realtor.com’s latest research.
Breaking Down the Numbers
Let’s get straight to it:
- National median asking rent: $1,691—falling for the 19th consecutive month to its lowest point since April 2022—but still 14.4% higher than five years ago (2020).
- NYC median rent (0-2 bedrooms): $2,967.
- Manhattan median rent: $4,487 (up 5.4% YoY) (according to Realtor.com’s December 2024 report on the NYC rental market, which provided data for specific NYC boroughs).
- Brooklyn median rent: $3,800 (up 5.8% YoY).
Queens, Staten Island, and the Bronx also saw rent increases, but at a more moderate pace.
Manhattan saw the steepest spikes, particularly for smaller units: 0-2 bedroom apartments in the borough jumped 9% year-over-year, reaching $4,387 per month. Meanwhile, larger 3+ bedroom units rose just 0.8% to $7,091—a sign that younger renters may be driving the demand for smaller spaces.
Compare that to the most recent rental data across the 50 largest U.S. metros.
Top 10 Metros with the Biggest Annual Increases in Median Rent:
- New York-Newark-Jersey City, NY-NJ – +6.8% (0-2 bedrooms; median rent: $2,977)
- Kansas City, MO-KS – +6.0% (median rent: $1,370)
- Detroit-Warren-Dearborn, MI – +3.6% (median rent: $1,461)
- Washington-Arlington-Alexandria, DC-VA-MD-WV – +3.3% (median rent: $2,283)
- Oklahoma City, OK – +2.0% (median rent: $1,027)
- Milwaukee-Waukesha, WI – +1.3% (median rent: $1,642)
- San Jose-Sunnyvale-Santa Clara, CA – +1.3% (median rent: $3,300)
- Baltimore-Columbia-Towson, MD – +1.2% (median rent: $1,795)
- Columbus, OH – +1.1% (median rent: $1,198)
- Pittsburgh, PA – +0.6% (median rent: $1,440)
10 Metros with the Highest Median Rents for February 2025:
- San Jose-Sunnyvale-Santa Clara, CA – $3,300 (+1.3% YoY)
- New York-Newark-Jersey City, NY-NJ – $2,977 (+6.8%)
- Boston-Cambridge-Newton, MA-NH – $2,936 (+0.7%)
- Los Angeles-Long Beach-Anaheim, CA – $2,715 (-2.5%)
- San Francisco-Oakland-Fremont, CA – $2,678 (-3.3%)
- San Diego-Chula Vista-Carlsbad, CA – $2,667 (-6.0%)
- Washington-Arlington-Alexandria, DC-VA-MD-WV – $2,283 (+3.3%)
- Miami-Fort Lauderdale-West Palm Beach, FL – $2,319 (-2.2%)
- Riverside-San Bernardino-Ontario, CA – $2,071 (-3.6%)
- Seattle-Tacoma-Bellevue, WA – $1,957 (-0.8%)
National Rent Trends by Unit Size:
- Studio Units: $1,413 (down 0.8% YoY, up 9.7% over five years).
- 1-Bedroom Units: $1,583 (down 0.7% YoY, up 14.3% over five years).
- 2-Bedroom Units: $1,887 (down 0.7% YoY, up 18.3% over five years).
Studio rent growth remains volatile but aligned with larger units in February at just above -1% year over year.
As for long-term demand for larger rentals, two-bedroom units saw the strongest five-year rent growth (18.3%), likely due to fewer young renters becoming homeowners and more of them living with roommates.
A Tale of Two Markets: NYC vs. the Rest of the U.S.
So, why is NYC rent climbing while national rent trends downward?
One major factor: supply. Across the country, a wave of new rental construction is pushing prices down—but that’s not happening in NYC, where new builds remain limited.
Another key trend is absorption rates—the percentage of newly built rentals leased within three months. While the national rate sits at 55%, the Northeast (including NYC) saw a year-over-year increase from 58% to 67%, suggesting demand remains strong despite rising costs.
Where Are Rents Rising Fastest?
While Manhattan leads the pack, every borough saw rent increases—some more dramatic than others.
- Brooklyn: Rent rose 5.8% YoY, with the median hitting $3,800.
- Queens: A mixed bag, but still on the rise. Two-bedroom units in Forest Hills now average $2,800, while three-bedrooms in Jamaica are at $2,850.
- The Bronx: Rents increased just 4% YoY—its slowest growth since March 2022—but prices remain 46.2% higher than in December 2019.
- Staten Island: Median rents are hovering around $2,900, with listings sitting longer on the market than last year.
Meanwhile, some apartments are staying on the market much longer than they did in early 2024:
- Manhattan: 51 days on market (up 104% YoY).
- Brooklyn: 48 days (up 60% YoY).
- Queens: 46 days (up 39% YoY).
- Staten Island: 36 days (up 12.5% YoY).
- Bronx: 38 days (down 1.3% YoY—the only borough with a decrease).
What This Means for Agents and Investors
For real estate professionals, these numbers present both challenges and opportunities:
- Rents are rising, but so are days on market. If you’re working with landlords, pricing strategies and incentives (like concessions) will be key.
- Smaller units are in high demand, especially in Manhattan. If you’re helping investors, targeting studio and one-bedroom properties could be a smart move.
- Buyers who were waiting for lower rents may be disappointed. With NYC bucking the national trend, renters could pivot to buying—especially in outer boroughs where pricing is more stable.
NYC’s rental market isn’t cooling off anytime soon, and whether you’re helping clients buy, rent, or invest, staying ahead of these trends is crucial.
The key takeaway? Know your borough, know your numbers, and be ready to adapt.