
The U.S. ranks only 24th on the World Happiness Report, despite being one of the wealthiest countries on the planet.
Whether you agree with that or not, it probably got you thinking. And the folks at WalletHub took that as their cue to find out where Americans are happiest, city by city.
The research says money stops boosting happiness once household income reaches $75,000 a year (adjusted for inflation). Beyond that, where you live can make a big difference in how happy you are with your day to day.
WalletHub measured key happiness metrics across 182 cities. And the cities at the top of their running might surprise you.
So, what separates a happy city from an unhappy one?
What WalletHub Measured
WalletHub built this ranking from the 150 most populated cities in the country, plus at least two of the most populous cities in every state. That’s a broad enough sample to cover nearly every market a real estate professional might work in.
The study leaned on 29 different metrics, grouped into three categories and weighted unevenly.
- Emotional and physical well-being: 50 of 100 possible points, more than the other two categories combined
- Income and employment: 25 points
- Community and environment: 25 points
The data came from established sources:
- U.S. Census Bureau
- Bureau of Labor Statistics
- F.B.I.
- C.D.C.
- Sharecare
- WalletHub’s own research
One number stands out among the study’s inputs: $75,000. Research cited in the report found that income stops boosting happiness once a household crosses that line.
WalletHub analyst Chip Lupo explained what fills the space beyond a paycheck.
“Research shows that having more money only increases your happiness until you’re making at least $75,000 per year – anything more you earn likely won’t have an impact. Therefore, when deciding where to live to maximize your happiness, you’ll want to pick a city that offers more than just a decent average income. The ideal city provides conditions that foster good mental and physical health, like reasonable work hours, short commutes, good weather, and caring neighbors.”
The Top 10 Happiest Cities in America
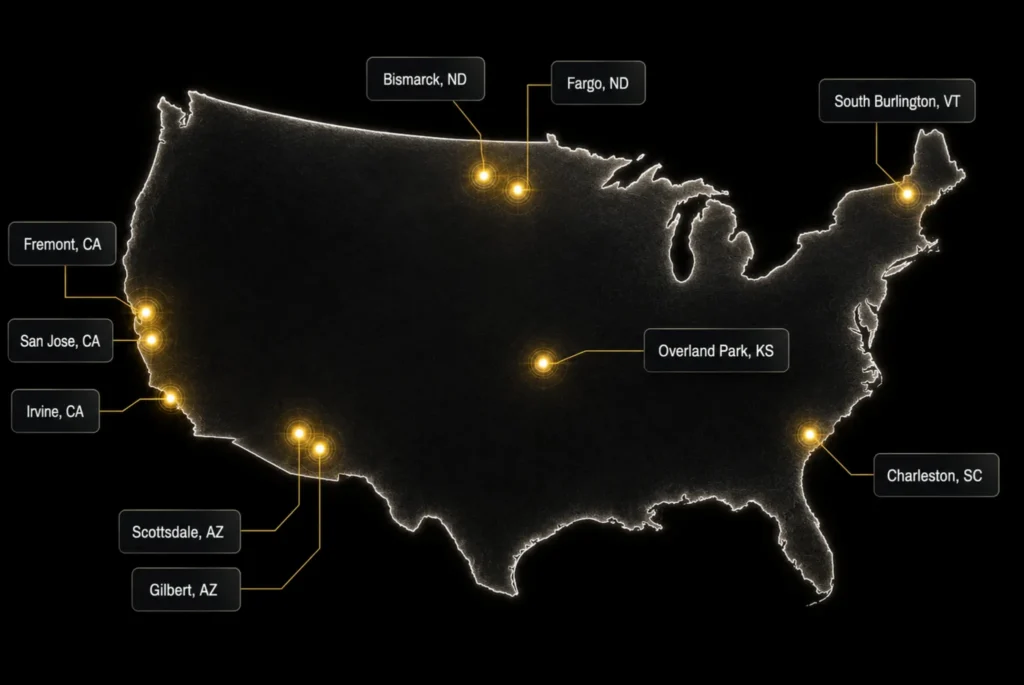
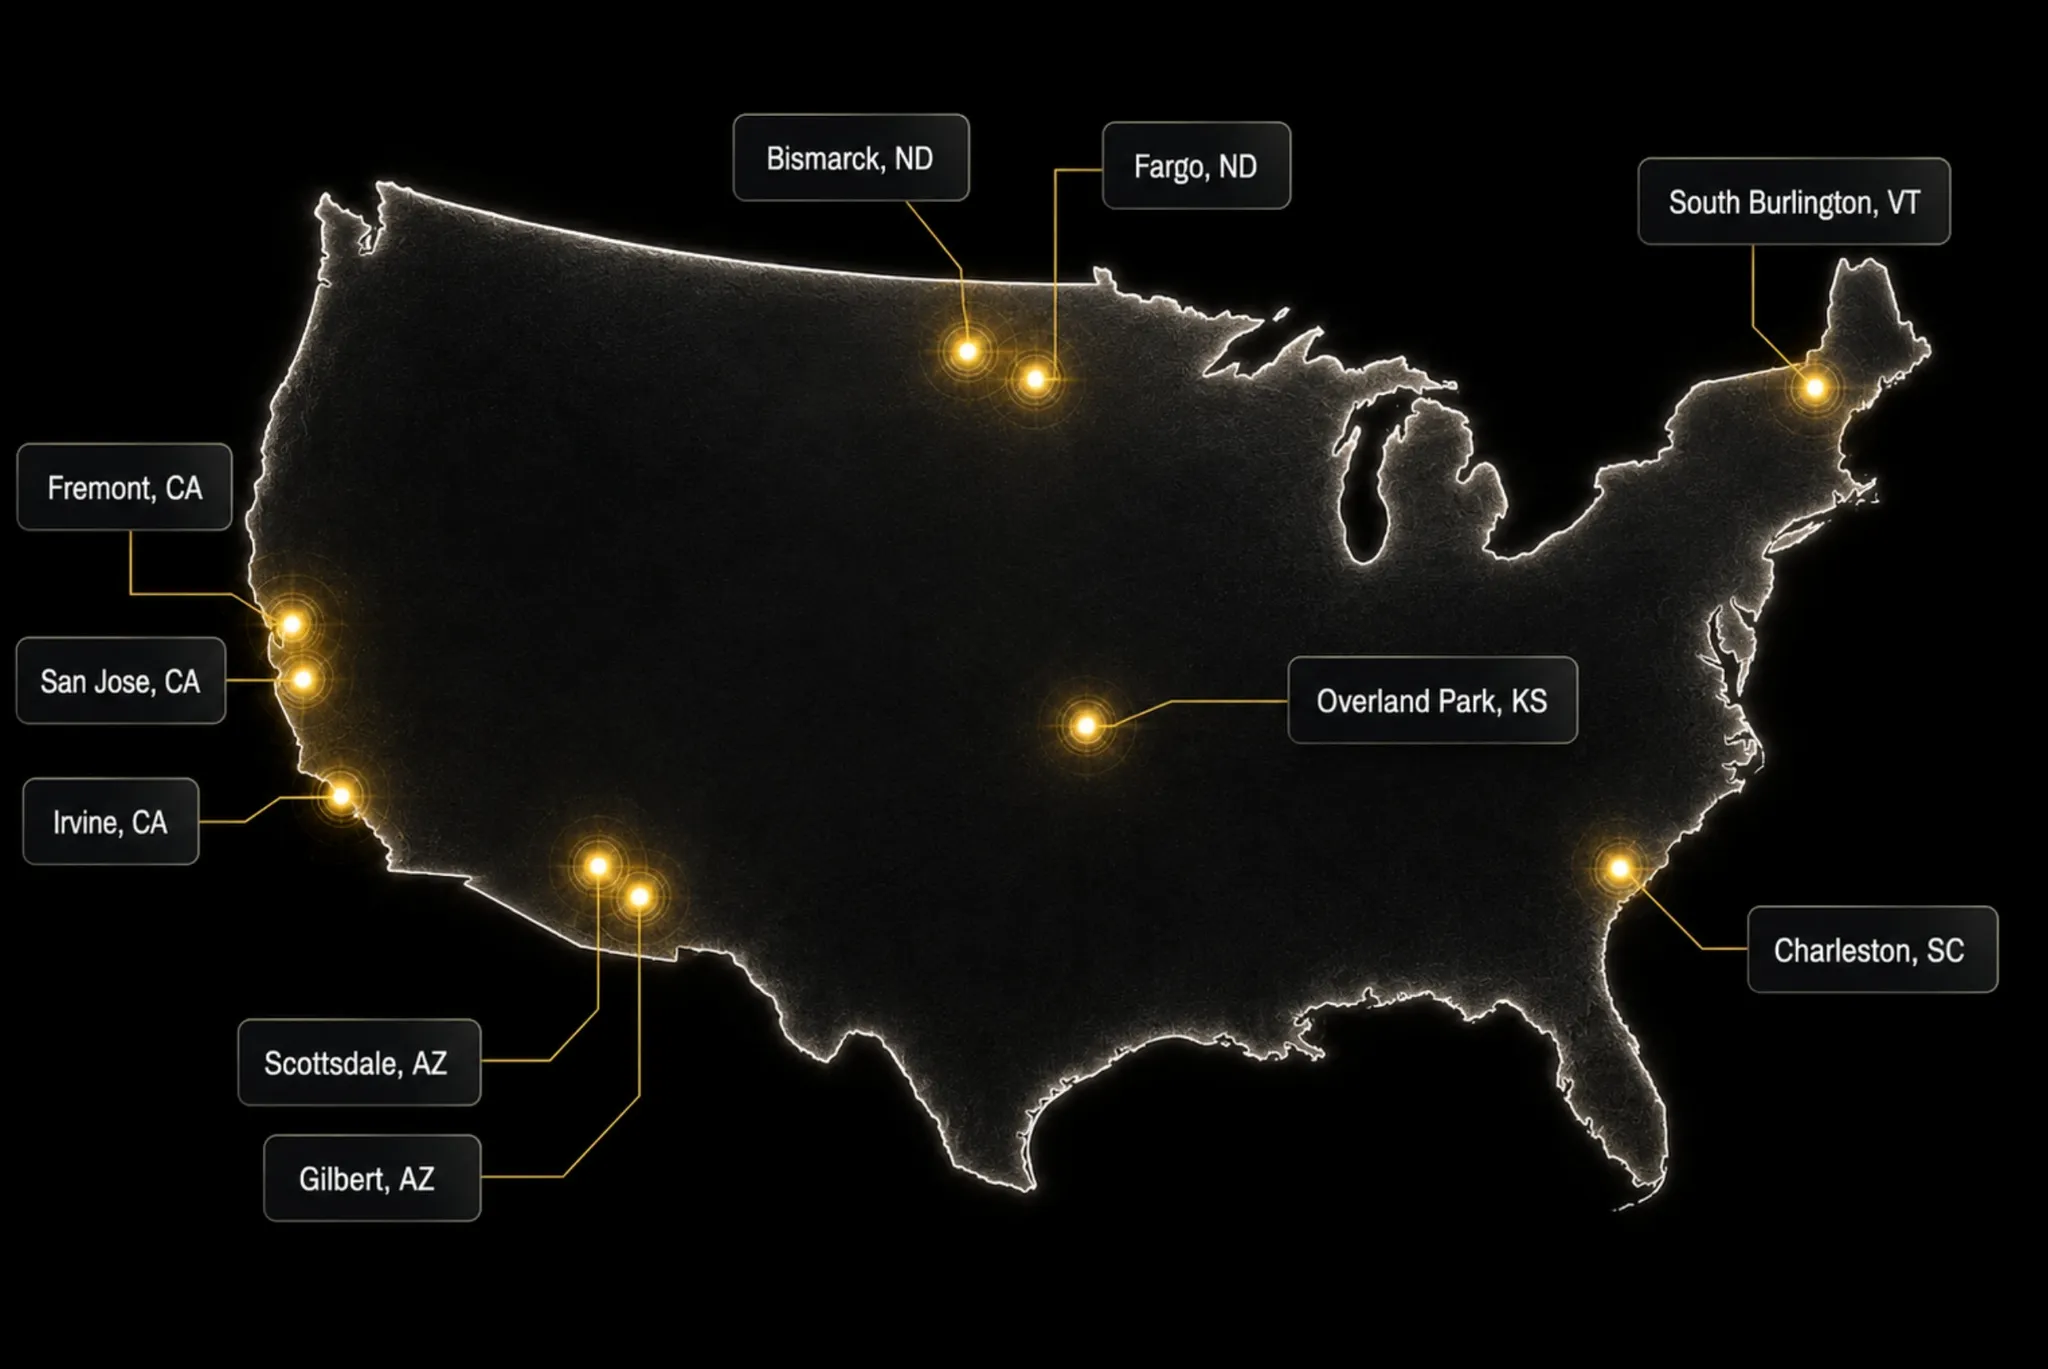
Fremont, California topped WalletHub’s ranking of 182 cities. Here’s how the rest of the top ten shook out:
- Fremont, CA
- Bismarck, ND
- Scottsdale, AZ
- South Burlington, VT
- Fargo, ND
- Overland Park, KS
- Charleston, SC
- Irvine, CA
- Gilbert, AZ
- San Jose, CA
That overall rank comes from blending three separate sub-ranks: one for well-being, one for income and employment, one for community and environment. Those three numbers don’t always point in the same direction for a given city.
- Seattle: No. 15 overall, No. 6 in income and employment, No. 152 in community and environment
- Boston: No. 63 overall, No. 8 in income and employment
- Columbia, SC: No. 86 overall, No. 9 in community and environment
Rounding out the top 20 in WalletHub’s ranking:
- Burlington, VA
- Madison, WI
- Columbia, MD
- Chandler, AZ
- Seattle, WA
- Plano, TX
- San Francisco, CA
- Lincoln, NE
- Portland, ME
- Tempe, AZ
A city sitting outside the overall top 20 can still hold one of the best category scores in the country. The overall number is only the headline. The sub-ranks tell you more about what makes a city rise or fall on the list.
But your local knowledge may be more reliable than both.
Why Fremont Topped the List
Fremont ranked 89th nationally in income and employment, a middling score by any measure. It still finished No. 1 overall, powered almost entirely by its well-being score.
Eighty percent of Fremont households earn more than $75,000 a year, the highest share of any city in the study. That’s the exact income threshold WalletHub’s research ties to peak happiness.
The New York Times described what daily life in Fremont looks like:
- Highly walkable streets
- Mild weather most of the year
- High rates of sports participation
- Average life expectancy of almost 82 years
WalletHub’s own numbers add more detail:
- The highest life-satisfaction score of any city in the study
- The 7th-lowest depression rate among all 182 cities
- The lowest divorce and separation rate in the country, at 9.3 percent
- A No. 5 ranking on WalletHub’s Most Caring Cities list
Bismarck, Fargo, and the Cold-Weather Surprise
Bismarck and Fargo, both in North Dakota, took the No. 2 and No. 5 spots. Winter there runs long and cold, which makes their place in the top five stand out.
Bismarck topped the entire study in one category: community and environment.
- 9th-highest share of adults reporting good or better health
- The largest average amount of daily leisure time of any city studied
- 7th-highest score on Sharecare’s Community Well-Being Index
Lupo told NYT what that translates to day to day for residents.
“It’s not as hustle and bustle as it would be in a major metro area like New York City or Washington, D.C. So residents have more opportunities to unwind, spend time with family and focus on personal hobbies or interests.”
Where the Rankings Split Widest
Some of the sharpest differences in this study show up inside individual metrics, not the overall list.
Lowest depression rates:
- Jersey City, NJ
- Hialeah, FL
- Miami, FL
- Pearl City, HI
- Pembroke Pines, FL
Highest depression rates:
- Portland, OR
- Charleston, WV
- Lewiston, ME
- Knoxville, TN
- Huntington, WV
Huntington’s depression rate runs three times higher than Jersey City’s, the widest spread of any metric in the study.
Sleep tells a similar story. South Burlington’s adequate-sleep rate runs about twice as high as Detroit’s, the widest sleep-rate split in the study.
Highest adequate-sleep rates:
- South Burlington, VT
- Burlington, VT
- Missoula, MT
- Portland, OR
- Denver, CO
Lowest adequate-sleep rates:
- Cleveland, OH
- Newark, NJ
- Pearl City, HI
- Honolulu, HI
- Detroit, MI
Detroit closes out the overall ranking too, finishing 182nd out of 182 cities studied.
Looking up your own city, or the closest comparable one on the list, takes a few minutes. It’s a good data point to have on hand before it ever comes up in conversation with a client.
Say your city is ranked at the bottom, but you know things about it that defy WalletHub’s ranking. Or say your market is in the top 10 but you know some things inbound buyers need to know before they commit to a home purchase.
Your local expertise will ultimately be more helpful to your clients than the ranking of a national publication.
Use it to help buyers gain the understanding they need to make the most of their new home.