


The doomsday prophets on X are again forecasting the worst. And this time, they’re announcing an imminent crash for the D.C. housing market in particular.
The “Darth Powell” account is one of the more notorious for alarmist posts on the housing market. And according to one of his most recent tweets, D.C. is seeing a significant increase in inventory, presumably in response to recent layoffs by the new administration’s Department of Government Efficiency (DOGE).
The wildest shit is happening near Washington DC, here is Arlington VA
Everything is being put on the market pic.twitter.com/jkPYbkdCuv
— Darth Powell (@VladTheInflator) February 14, 2025
Enter Logan Mohtashami, lead analyst for HousingWire, who’s been sharing the data we all need to counter Chicken Little forecasts with actual data.
If you’ve been watching Hot Sheet long enough, you know its host Byron Lazine is quick to respond to misleading tweets and mainstream media headlines. So, it’s no surprise he made Mohtashami’s responses a key topic in today’s broadcast:

Read on for a quick overview of Mohtashami’s responses on X.
Is the D.C. Housing Market Crashing?
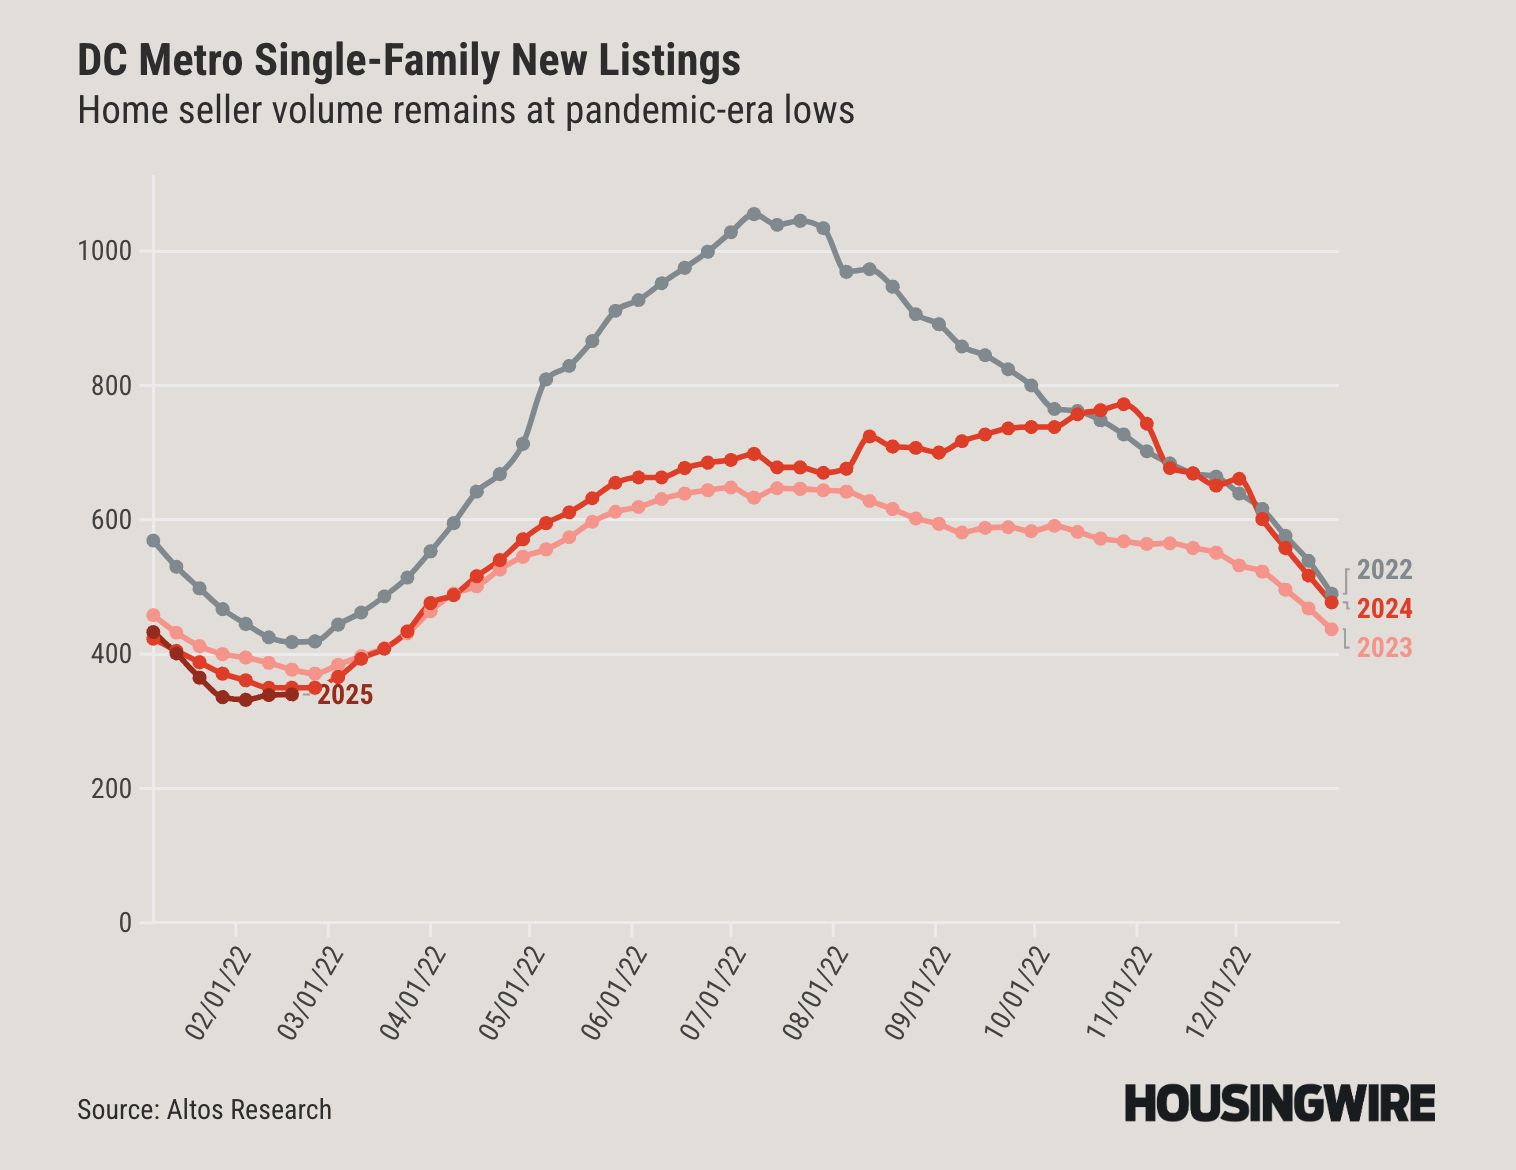
As Mohtashami points out in his HousingWire article, despite social media speculation about a surge in inventory due to federal job cuts, the data does not support this claim.
According to data from Altos Research, inventory levels in the DC metro remain close to COVID-era lows.
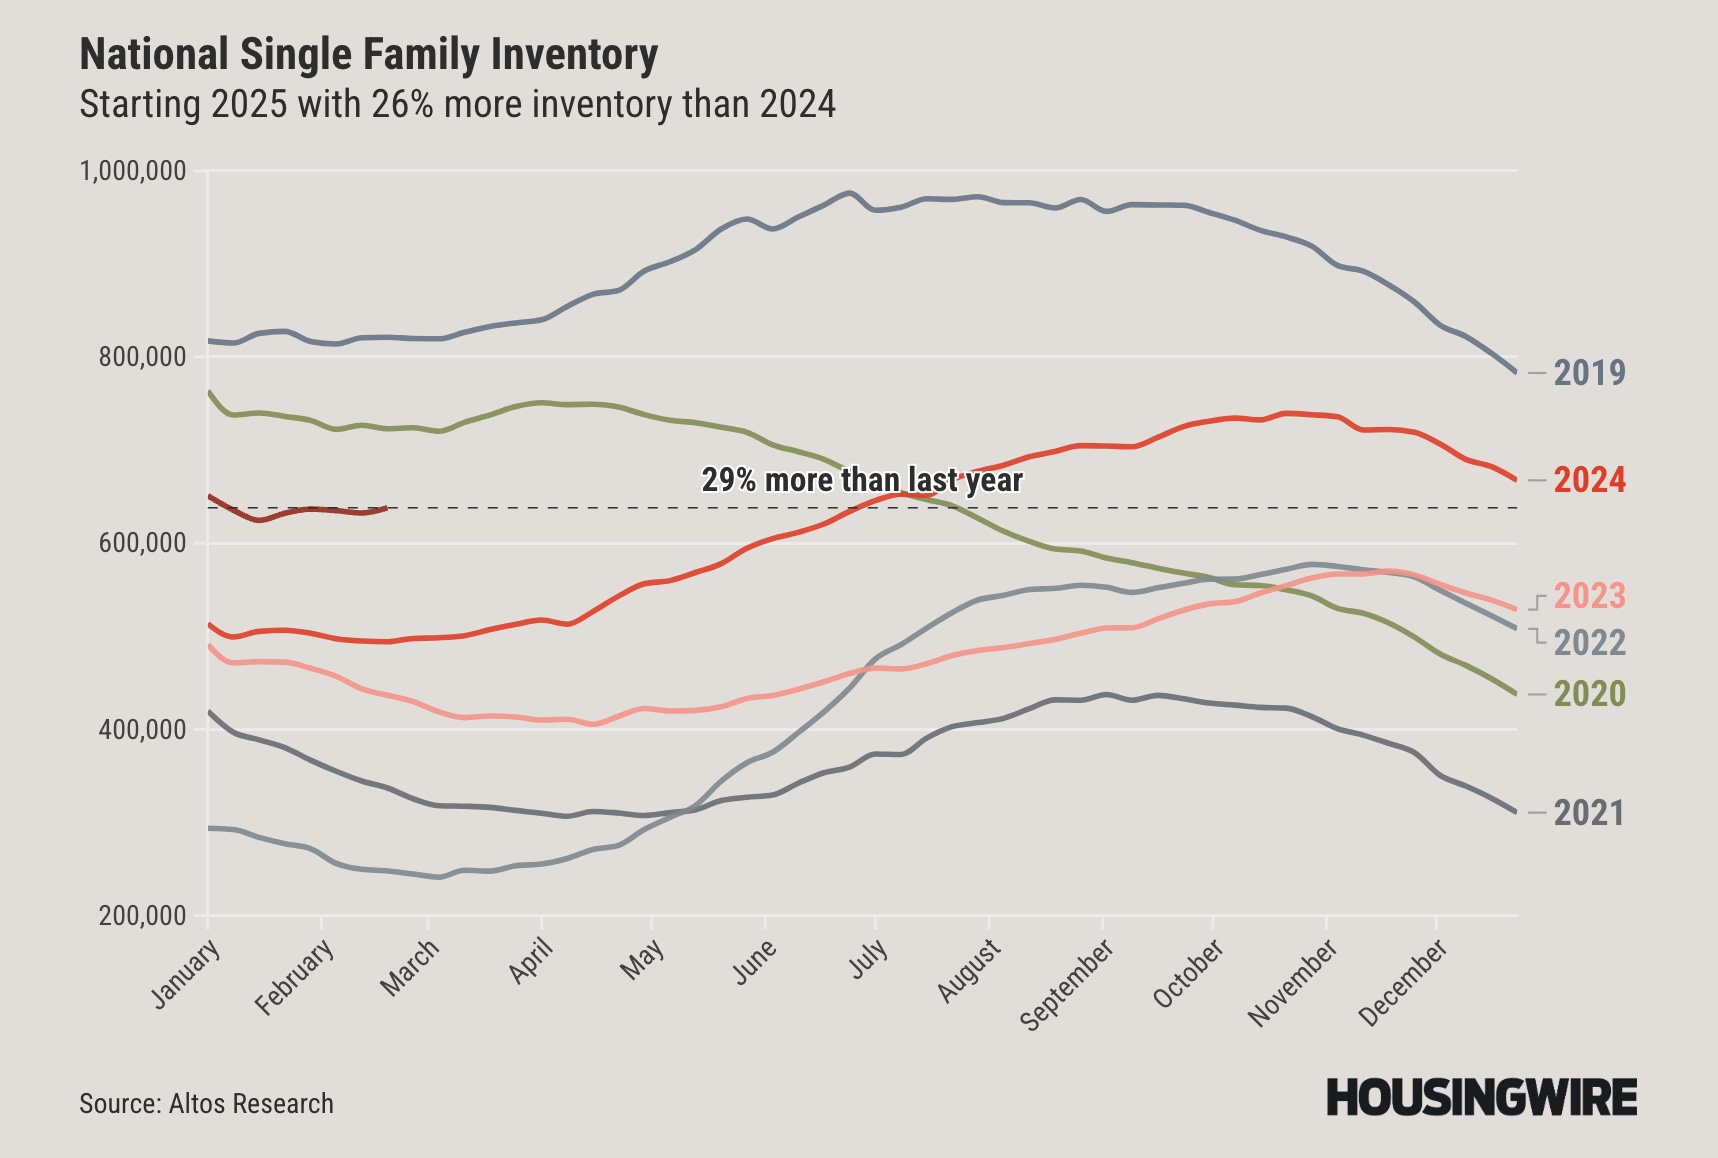
National housing inventory increased slightly last week, but it remains well below historical norms.
Remember one thing: active inventory is all that matters.
NAR data
Historically, between 2-2.5 million
2007 4,000,000
2025 1,150,000
🫡 https://t.co/UDjFocWqks pic.twitter.com/Iyhaena8RU— Logan Mohtashami (@LoganMohtashami) February 16, 2025
As for Washington, D.C., inventory is not experiencing the drastic rise that doomsday predictions suggest.
No?
No one wants to debate me live on the massive surge of inventory that happened in the D.C. housing market the last few weeks
You're not as dumb as your X profiles look, good boys, enjoy your Sunday https://t.co/6YqqRDE4eq pic.twitter.com/PafFMfRACC— Logan Mohtashami (@LoganMohtashami) February 16, 2025
New Listings Data is Normal
While new listings are increasing year over year (56,559 vs. 49,556 in 2024), the numbers are far below levels seen during the housing bubble crash (250,000-400,000 per week).
The charts shared in Mohtashami’s article clearly show inventory levels and trends both at the national level and in the D.C. market.
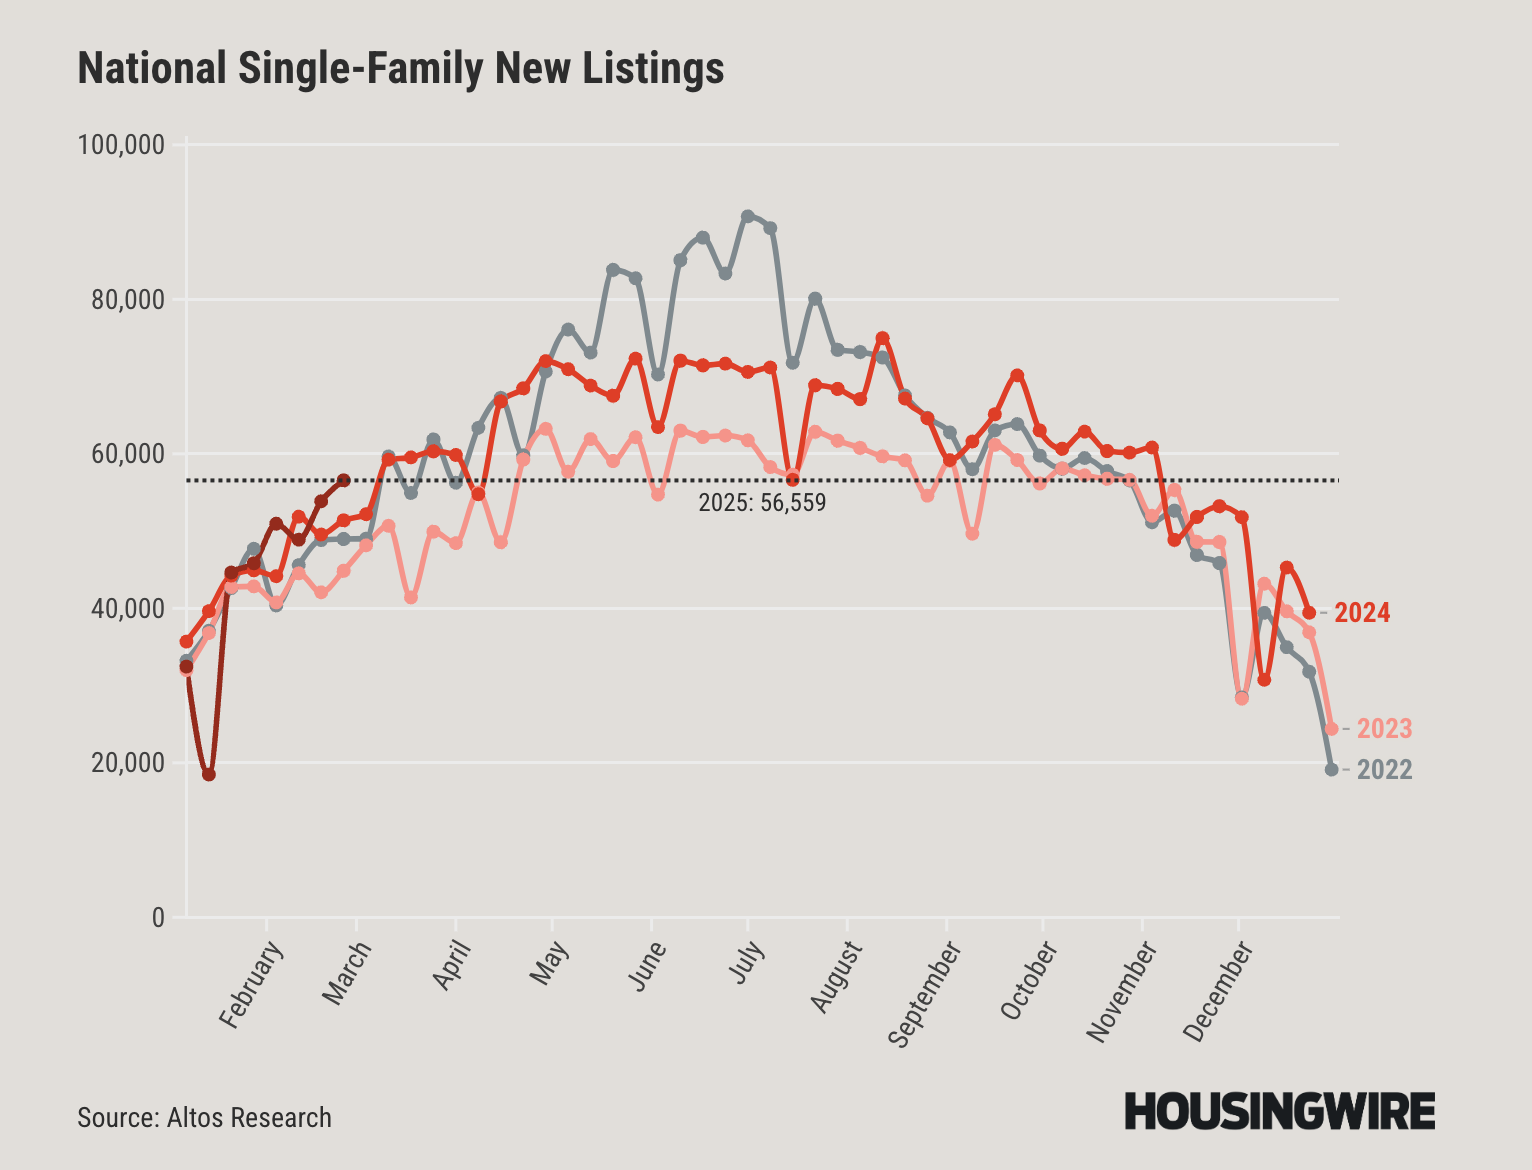
DC’s new listing trends also show no signs of an extreme surge.
Price Cuts Are Moderate
Nationally, 33% of homes had price reductions last week, slightly higher than last year’s 30%.

Meanwhile, in DC, price cut percentages remain below the national average, indicating no major market distress.

Mortgage Rates & Pending Sales
Mortgage rates are fluctuating between 5.75% and 7.25%. As of today, the rate is floating just under 7%, which could motivate more buyers. A continuing decline in rates could further slow home price growth.
Mohtashami reveals the latest home price trends in two charts he shares on X, both of which indicate slower growth in home prices. The first chart shows the U.S. house price index (FHFA), comparing the Nominal Index (the one preferred by doomsday prophets on X) with the Real Index.
— Logan Mohtashami (@LoganMohtashami) February 16, 2025
The second chart shows the Real S&P/Case Shiller Home Price Index, which shows minimal year-over-year home price growth for the 10-city composite and year-over-year declines in both the national index and 20-city composite.
Home prices are up month-over month but only by 0.2% (for all three indices).
All the price forecasts the doomers provide are in nominal terms; they don't discuss real home prices. Trust me, I ask them this all the time.
As I have had back to back negative real home price forecasts https://t.co/3velx0ucDh pic.twitter.com/ACMjx4AmvB— Logan Mohtashami (@LoganMohtashami) February 16, 2025
Pending home sales showed improvement in late 2024, but rising mortgage rates in 2025 have caused a slight year-over-year decline. That said, levels are still up from 2023.

Federal Job Cuts Could Be a Future Factor
As Mohtashami points out, rising jobless claims in DC due to potential federal layoffs (estimated at 200,000) are something to keep an eye on. But as of yet, no significant market impact is evident.
We will be discussing the future of the D.C. housing market in one of our podcasts this week. I will teach you what to look for so you won't fall victim to rookie mistakes that have been made on X https://t.co/5MuLJFH4mC pic.twitter.com/kqcvm2IEcy
— Logan Mohtashami (@LoganMohtashami) February 16, 2025
Watch today’s Hot Sheet for Byron’s clear and thorough breakdown of the data in Mohtashami’s article and tweets.


 - BAM")


