
BAM Key Details:
- Clever Real Estate’s 2026 report reveals the best and worst places to live in America, with Nashville topping the list of most desirable cities at 21.4% of the vote.
- Chicago ranks as the least desirable city, cited by 27% of the 1,000 Americans surveyed, and Florida holds the top state ranking for the third year running at 32%.
- Texas led the nation in net migration in 2024, gaining 392,287 more residents than it lost.
A full 75% of Americans like where they live, up from 69% a year ago. That’s according to the latest report from Clever Real Estate, which also shows 26% of respondents who moved to chase happiness say it didn’t work.
This year’s rankings of the best and worst places to live in 2026 show safety and affordability driving the winners, while the same old cost complaints sink the losers.
Here’s a full breakdown, along with content ideas to highlight your local market, no matter where it lands on the list.
What Makes a Place Desirable (or Not)
These findings come from Clever Real Estate’s survey of 1,000 Americans, conducted June 24-25, 2026, paired with U.S. Census migration data at the state and metro level.
Safety and affordability lead the list of what Americans want from where they live.
- Low crime rates: 67% (up from second place in 2025)
- Low cost of living: 65%.
- Good weather: 57% (down from the No. 1 spot last year, a 10-point drop)
- Cleanliness: 57%
- Low tax rates: 54%
- Access to health care: 54%
- Low housing costs: 53%
- Lots of things to do: 50%
- Natural beauty: 49%
- Good infrastructure: 47%
The traits that make a place undesirable mirror this list in reverse.
- High crime rates lead at 73%
- High cost of living: 68%.
- High taxes: 66%
- Lack of cleanliness: 60%
- Expensive housing costs: 59%
- Run-down infrastructure: 59%
- Too much traffic: 57%
- Crowds: 50%
- Rude residents: 49%
- Bad weather: 48%
One newer concern appears in the numbers too. About 27% of Americans say loose regulation around data center construction makes a place undesirable, tied to worries about energy use and environmental impact.
The Most (and Least) Desirable Cities
Nashville holds the top spot for the second year in a row. Music City earned 21.4% of the vote, edging out Denver by just 0.4 percentage points.
Home prices there reflect that popularity. The median home price in Nashville sits at $484,252, about 21% above the national median of $399,771.
The top 10 most desirable cities in the country:
- Nashville, TN
- Denver, CO
- San Diego, CA
- Charlotte, NC
- Seattle, WA
- Tampa, FL
- Raleigh, NC
- Austin, TX
- Boston, MA
- Orlando, FL
Nashville skews older. About 28% of boomers name it their top city, compared with 13% of millennials and 11% of Gen Z.
Millennials favor Seattle (22%) instead, and Gen Z favors Chicago (27%).
Chicago ranks last among major cities, cited by 27% of Americans. Crime perception drives most of that reputation. Violent crime in the city has fallen for two years straight, reaching a decade low in 2025.
Cold winters and high taxes add to Chicago’s reputation problem. The city lost 418,351 residents last year, the fourth-highest outflow of any city studied.
Gen Z tells a different story about Chicago. The generation ranks it as their most desirable city, with 27% naming it a top-five place to live.
The least desirable cities in the country:
- Chicago, IL
- New York, NY
- Detroit, MI
- Los Angeles, CA
- San Francisco, CA
- Birmingham, AL
- Baltimore, MD
- Atlanta, GA
- Washington, DC
- Tampa, FL
The Most Desirable (and Least Desirable) States
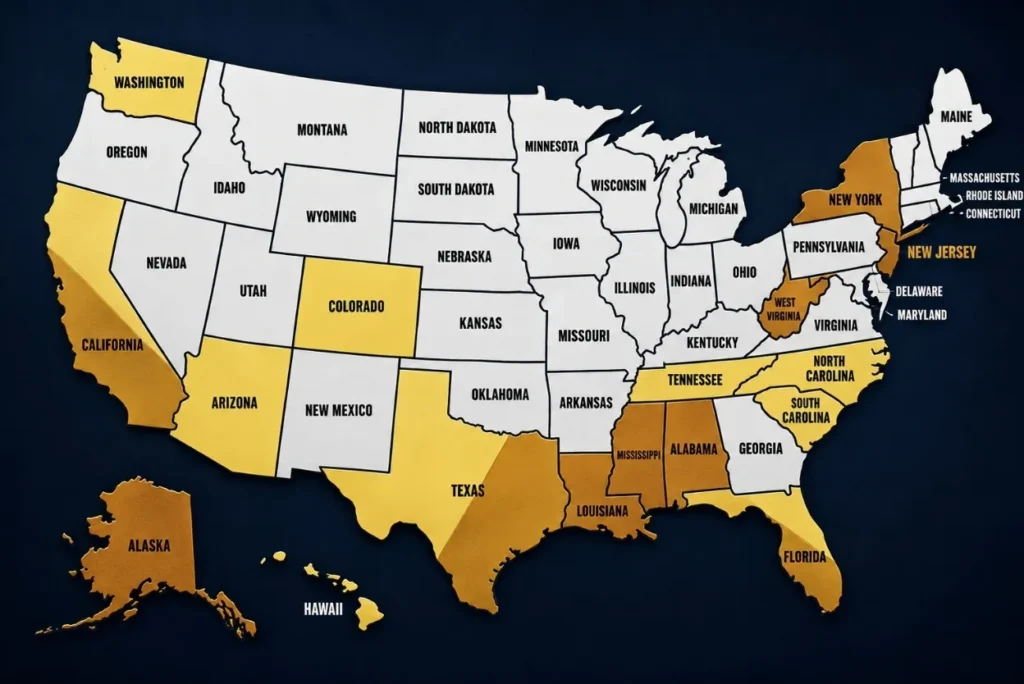
Florida holds the number one spot for the third year running, named by 32% of Americans as one of the best places to live.
California sits at No. 2, and its numbers dropped fast. Desirability fell from 33% in 2025 to 24% in 2026, a decline of nine percentage points in a single year.
Florida’s lead over California grew from one percentage point last year to eight points this year. Both states offer sunshine and beaches, and California’s higher cost of living likely explains part of the decline.
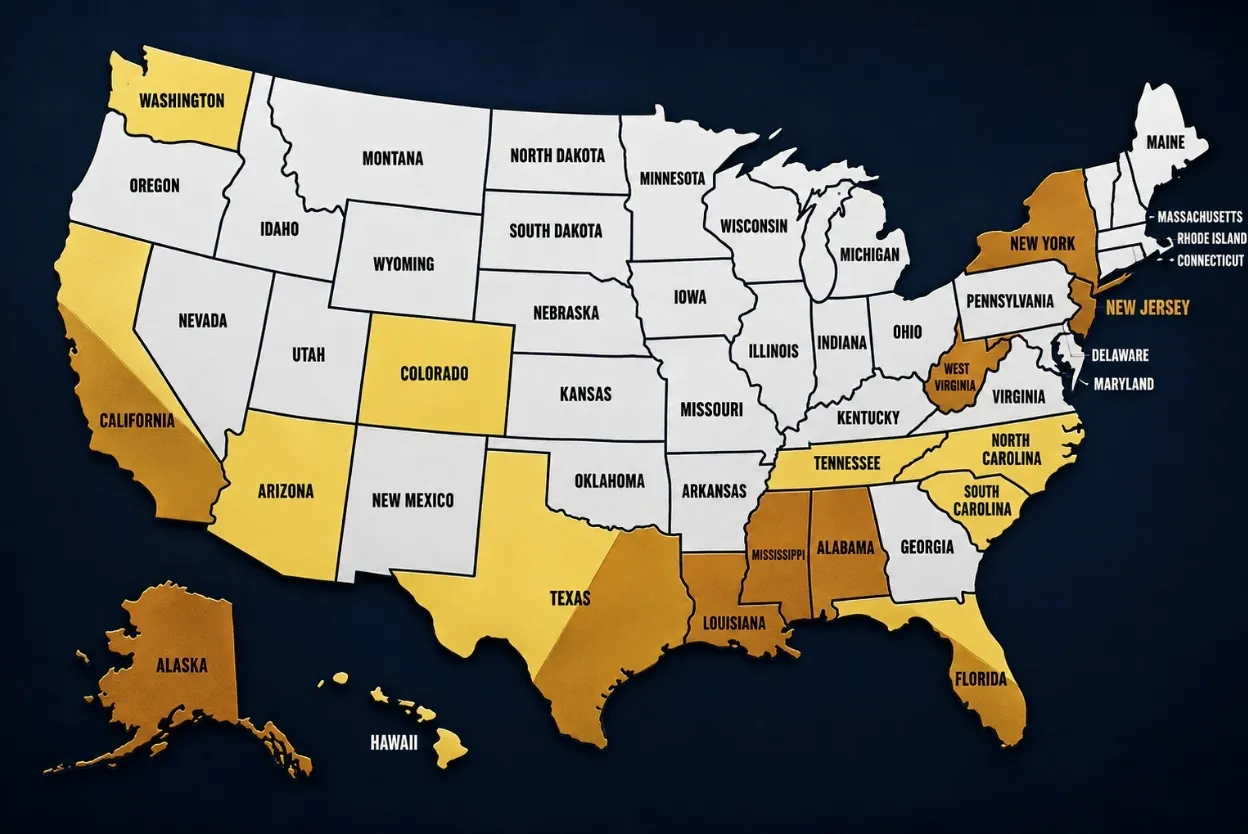
The most desirable states:
- Florida
- California
- Colorado
- Texas
- Hawaii
- North Carolina
- Tennessee
- Arizona*
- South Carolina*
- Washington
*Indicates a tie
The least desirable states:
- California*
- New York*
- Alabama
- Florida*
- Texas*
- Mississippi
- Alaska
- New Jersey
- Louisiana
- West Virginia
California and New York tie for the least desirable state in the country. For California, 33% call it undesirable, compared with 24% who call it desirable. New York fares worse. Just 15% call it desirable, while 33% call it undesirable, more than double the positive number.
The same complaints sit behind both rankings:
- High living costs: 68% call this undesirable
- High taxes: 66%
- Expensive housing: 59%
Affordability alone doesn’t guarantee desirability. Alabama and Texas rank among the cheapest states in the country, and both still appear on this least-desirable list for other reasons.
The Play for Agents
Understanding these patterns helps you guide relocating clients toward markets that fit their budget and their priorities, rather than just their assumptions about a place.
It also creates an opportunity for your real estate content.
In fact, every ranking in this report doubles as content or talking points for agents working these markets right now.
A few examples:
If your market landed in the top 10 (city or state)
Screen-record yourself scrolling the list and stopping on your market. Caption: “We didn’t need a survey to tell us this, but here’s the proof.”
Pair it with one local stat that backs up why people love living there: a new restaurant row, a park reno, a school rating.
If your market landed in the bottom 10
Pull the specific complaint tied to your city (crime, taxes, cost) and give clients the real story behind the headline. Chicago is the example already in the data: violent crime hit a decade low in 2025, but perception hasn’t caught up.
If your city has a similar gap between reputation and reality, that gap is your content. “Here’s what the ranking gets wrong about [city].”
If you work in a market that isn’t on either list
Use the criteria, not the rankings. Run your own city through the same 10 factors (crime, cost of living, weather, taxes, healthcare access, housing costs) and build a local scorecard. This positions you as the local data source instead of a bystander commenting on a national survey.
Pick the angle that fits your market and back it with real numbers. Keep it up, and local buyers and homeowners will start looking to you as the person who knows your market best.