
BAM Key Details:
- Redfin reports that nearly 80% of U.S. metros are now buyer’s markets.
- Homebuyer demand dropped to 966,752 buyers in July, the lowest level on record, and seller counts held at 1,462,921.
- Sellers outnumber buyers by 51.3% nationwide, pushing 39 of 49 major metros into buyer’s market territory.
The number of buyers looking for a home fell to about 966,752 in July, the lowest count on record.
Redfin counted about 1,462,921 sellers in the market during the same month, nearly half a million more than the buyers competing for those homes.
When sellers outnumber buyers by this much, the buyers left in the market get more room to negotiate on price, contingencies, timeline, etc. There’s more leeway for sweetening the pot.
This changes how to set both buyer and seller expectations going into fall. Are you ready for it?
Buyer Demand Hit Its Lowest Point on Record
Buyers dropped to about 966,752 in July, down 2.5% from June. Sellers fell too, down 0.3% to 1,462,921, the lowest seller count in a year.
The difference between those two numbers comes to nearly half a million people.
Even with their numbers declining, sellers now outnumber buyers by 51.3%, up from 47.9% in June and close to December 2025’s record of 51.8%.
A few things caused the drop:
- Mortgage rates climbed to their highest point in a year, squeezing what buyers could afford.
- Economic and political uncertainty kept house hunters on the sidelines.
- Some sellers pulled back once they noticed demand cool off.
Asad Khan, a senior economist at Redfin, explains what’s happening and what it means for the months ahead.
“Buyers are dropping out faster than sellers, giving the buyers who remain more options and more negotiating power.
“At the same time, uncertainty around whether the Fed will hike rates–and this summer’s rising mortgage rates–are keeping many would-be buyers on the sidelines.
“That makes the stretch between now and Labor Day a potential sweet spot for people who need to move: Buyers have leverage, while motivated sellers may be willing to negotiate before the early-fall rush brings some buyers back to the market. This could be the best chance for buyers and sellers to meet in the middle.”
Nearly 80% of Major Metros Are Now Buyer’s Markets
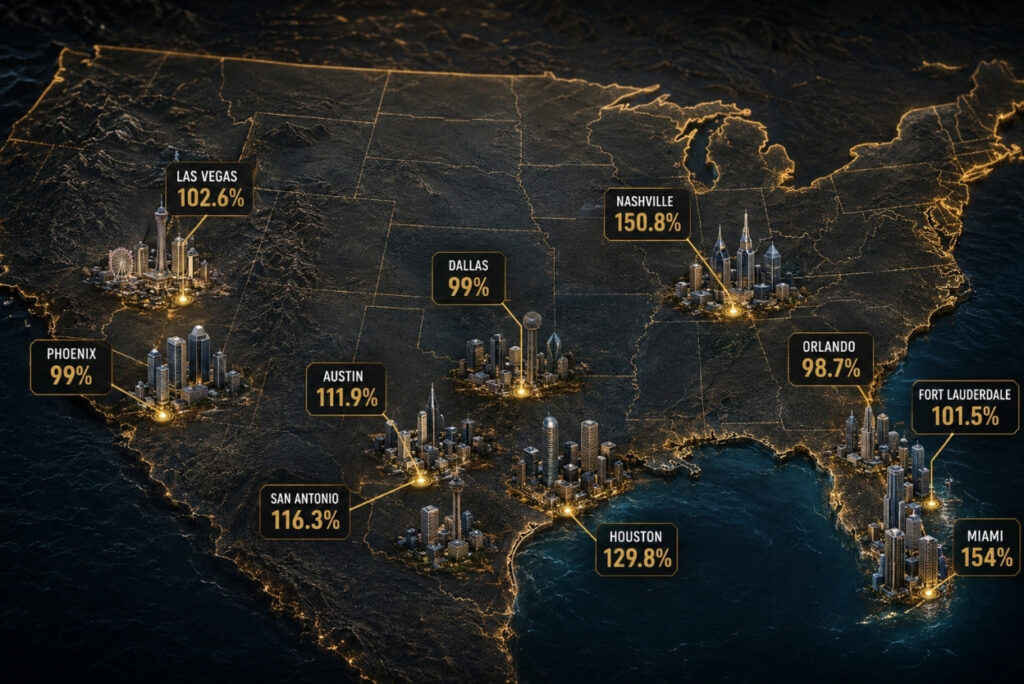
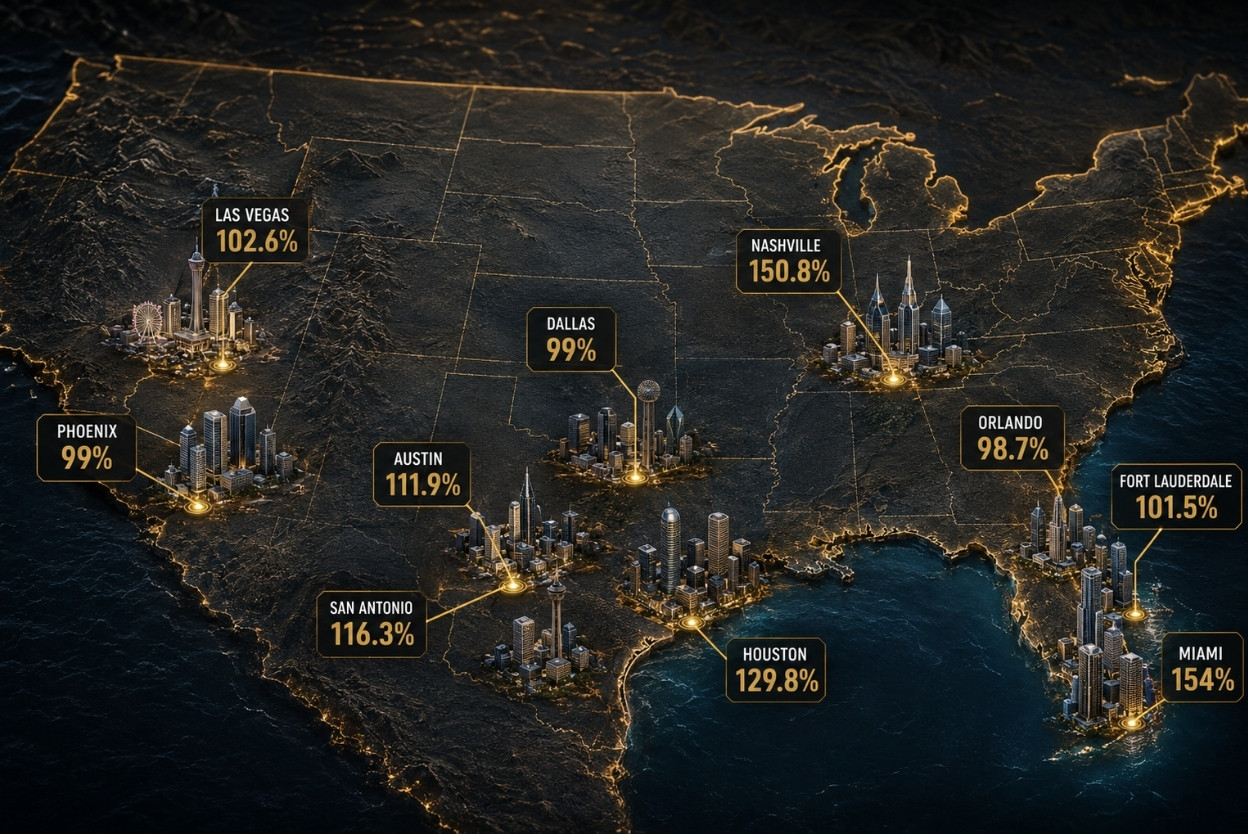
Nearly 80% of the major metros Redfin tracked in July count as buyer’s markets, 39 out of 49 cities (Fort Lauderdale was left out for lack of data). Miami tops the list by a wide margin.
Here are the ten cities where buyers hold the most leverage, ranked by how much sellers outnumber them:
- Miami, FL: 154%
- Nashville, TN: 150.8%
- Houston, TX: 129.8%
- San Antonio, TX: 116.3%
- Austin, TX: 111.9%
- Las Vegas, NV: 102.6%
- Fort Lauderdale, FL: 101.5%
- Phoenix, AZ: 99%
- Dallas, TX: 99% (tied with Phoenix)
- Orlando, FL: 98.7%
A few local patterns explain why these cities lead the list:
- Miami and Nashville built plenty of new homes during the pandemic boom, and investors bought many of them too. This inventory now meets a pool of local buyers priced out of the market.
- Miami carries extra weight from rising insurance costs, HOA fees, and climate risk on top of high prices.
- Houston, San Antonio, Austin, Las Vegas, Phoenix, Dallas, and Orlando all have builders adding new homes at a steady pace as buyer demand cools.
Buyers Are Gaining Even More Ground Month Over Month
The buyer’s markets in place got stronger in July. Redfin found that 34 of the 39 buyer’s markets saw their seller surplus grow from June to July.
The largest monthly jumps came in five cities:
- Miami: 134% in June to 154% in July
- Seattle: 46% to 65%
- Fort Worth: 67% to 86%
- Nashville: 135% to 150.8%
- Houston: 114% to 129.8%
Only five buyer’s markets moved the other direction in July: West Palm Beach, San Antonio, Pittsburgh, Virginia Beach, and Dallas.
A Handful of Metros Still Favor Sellers
Just six of the 49 metros Redfin tracked count as seller’s markets, places where buyers outnumber sellers by more than 10%.
Here they are, ranked from strongest to weakest:
- Nassau County, NY: -36.2% (as in ‘sellers outnumber buyers by a negative 36.2%’)
- Newark, NJ: -20.7%
- Providence, RI: -16.7%
- Milwaukee, WI: -15.1%
- New Brunswick, NJ: -12.9%
- Montgomery County, PA: -12.8%
A few things keep these markets tilted toward sellers:
- Years of limited new construction in most of these metros.
- Proximity to a major job center for the New York City suburbs.
- Relative affordability in Milwaukee, which keeps demand strong even with fewer new listings.
Home prices in these six seller’s markets rose 4.2% year over year in July. Prices in the 39 buyer’s markets rose 2.3% over the same period. The 1.9 percentage point difference shows how buyer competition pushes prices up when supply stays tight.
The Window Between Now and Labor Day
As Khan pointed out, the stretch between now and Labor Day looks like a real opening for buyers. It also works in sellers’ favor, more than fall does, for a specific reason.
Seller counts sit at their lowest point in a year right now. A home listed today competes against fewer other listings for whatever buyers remain active.
Wait until early fall, and buyer demand tends to pick up, drawing some buyers back into the market. Seller counts pick up too, since sellers who held off for a better moment start listing again once demand looks stronger. This fresh wave of listings competes for the same buyers coming back, which can undo the edge a seller might have been hoping for.
A seller who needs to move gets a shot at today’s smaller, more committed group of buyers without competing against next month’s flood of new listings.
A buyer ready to make an offer still holds real negotiating room. Clients on either side of a deal benefit from acting on that now, before the early-fall rush changes the math for both of them.