
Key Details:
- The National Association of REALTORS® reports that nearly 90% of metro areas saw home price gains in Q4 2024, with the national median price rising 4.8% year over year to $410,100.
- Mortgage rates ranged from 6.12% to 6.85%, while affordability slightly improved as typical monthly payments dipped 0.8% from the previous quarter.
Home prices increased in nearly 90% of metro markets in the final quarter of 2024, pushing affordability further out of reach for many would-be buyers.
While this is great news for homebuyers building equity, it’s a different story for first-time buyers, who faced stubbornly high prices and mortgage rates hovering near 7%.
According to the National Association of REALTORS® (NAR), the national median price for a single-family existing home climbed 4.8% year over year to $410,100—marking an increase from the previous quarter’s 3.2% growth.
Let’s break down the numbers and what they mean for real estate pros.
Home Prices Continue Upward Trend
Compared to a year ago, the national median single-family home price rose 4.8% to $410,100—a bigger jump than the 3.2% increase from the previous quarter. Over the past five years, home prices have surged nearly 50%.
Regionally, the biggest price gains came from:
- Northeast: +10.6%
- Midwest: +8.0%
- West: +4.0%
- South: +2.1% (but still had the largest share of home sales at 45.1%)
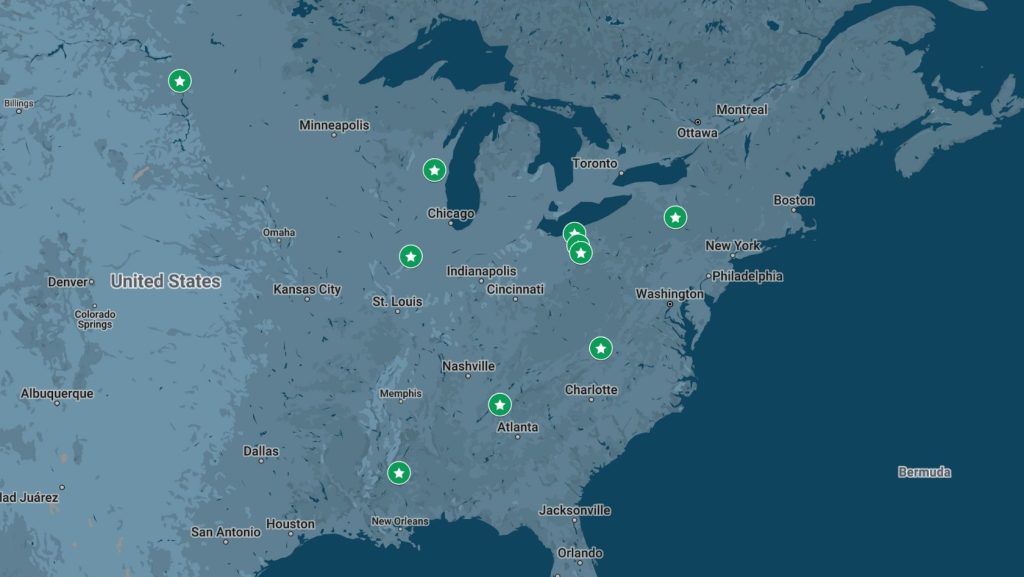
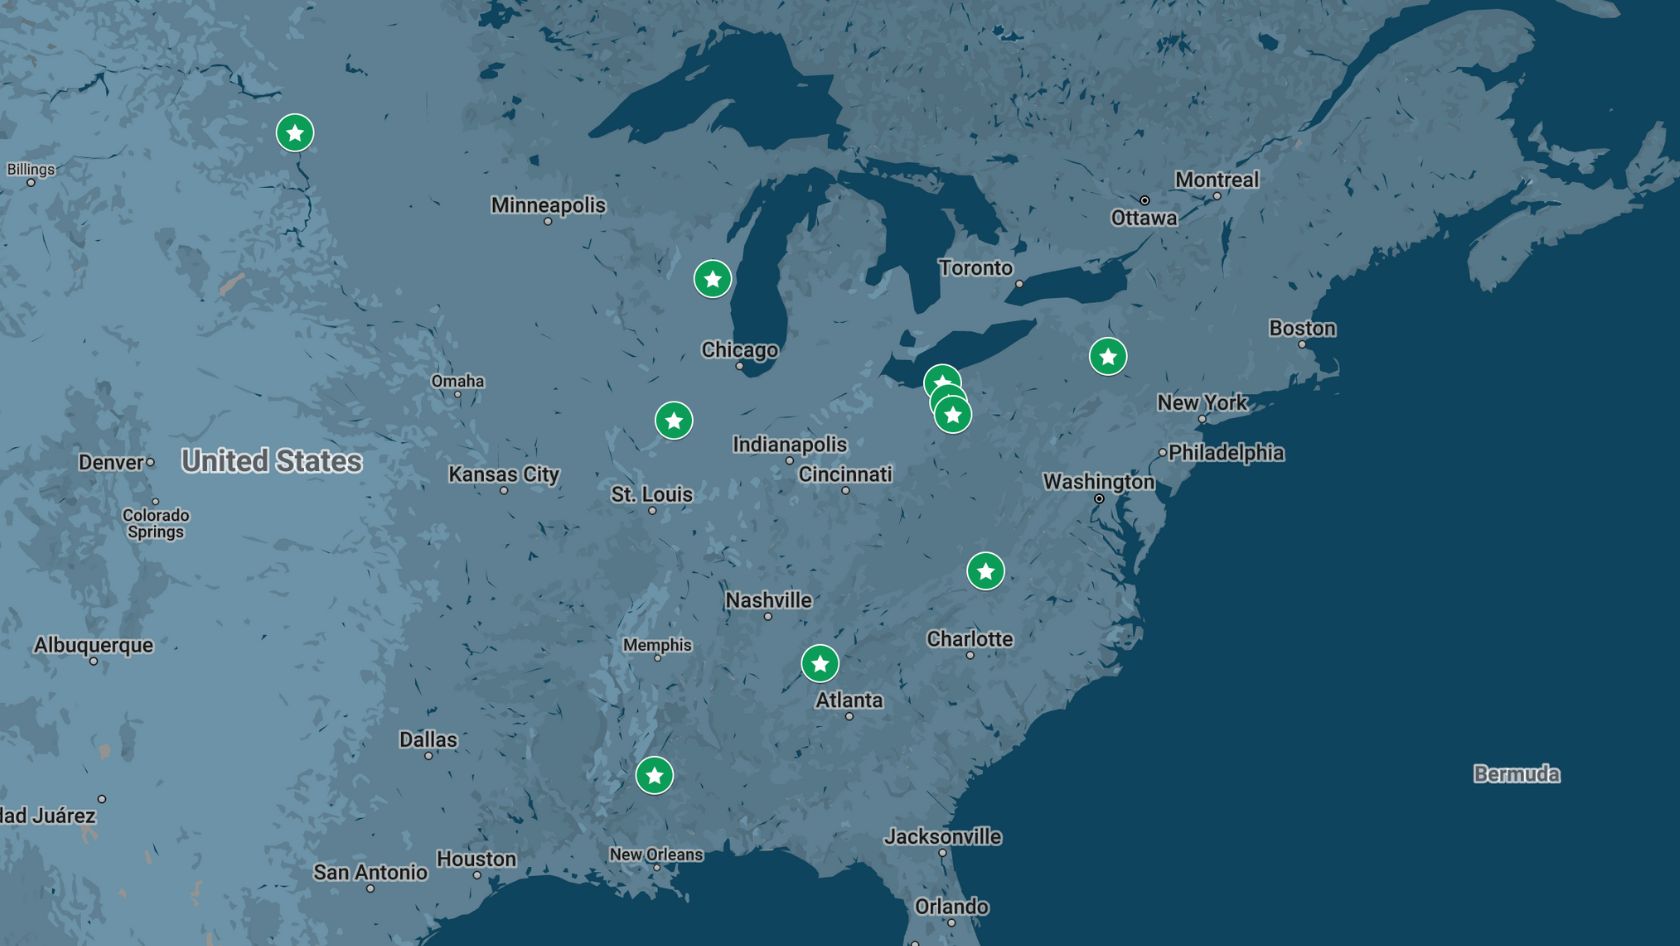
Some metro areas saw even more extreme increases, with Jackson, Mississippi, leading the way at 28.7%. Six of the top ten markets with the highest price growth were in the Midwest. Here’s where home prices climbed the fastest:
Top 10 Metro Areas with the Largest Price Increases:
- Jackson, MS (+28.7%)
- Peoria, IL (+19.6%)
- Chattanooga, TN-GA (+18.2%)
- Elmira, NY (+17.6%)
- Fond du Lac, WI (+17.6%)
- Cleveland-Elyria, OH (+16.4%)
- Bismarck, ND (+15.8%)
- Akron, OH (+15.5%)
- Blacksburg-Christiansburg, VA (+15.0%)
- Canton-Massillon, OH (+14.9%)

Record-high home prices and the accompanying housing wealth gains are definitely good news for property owners. However, renters who are looking to transition into homeownership face significant hurdles.
The Nation’s Most Expensive Housing Markets
On the flip side, some markets remain nearly unattainable for most buyers. Eight of the ten most expensive markets are in California, with San Jose leading the pack at $1.92 million. Here’s how the most expensive markets stacked up:
Top 10 Most Expensive Housing Markets:
- San Jose-Sunnyvale-Santa Clara, CA – $1,920,000 (+9.7%)
- Anaheim-Santa Ana-Irvine, CA – $1,360,000 (+4.7%)
- San Francisco-Oakland-Hayward, CA – $1,315,600 (+5.2%)
- Urban Honolulu, HI – $1,103,100 (+3.2%)
- San Diego-Carlsbad, CA – $985,000 (+5.7%)
- Salinas, CA – $943,900 (-5.0%)
- Los Angeles-Long Beach-Glendale, CA – $939,700 (+6.3%)
- San Luis Obispo-Paso Robles, CA – $927,200 (+1.7%)
- Oxnard-Thousand Oaks-Ventura, CA – $920,000 (+0.3%)
- Boulder, CO – $840,700 (-1.0%)
While a handful of markets saw slight price declines, they made up only 11% of metro areas, down from 13% in Q3.
Yun noted that relocating to lower-cost regions could be an option for some:
While recognizing many workers may not have the option to relocate, those who can or are willing to move may find more affordable conditions, especially given the wide variance in home prices nationwide.
Affordability Sees a Slight Boost
There’s a small silver lining for buyers—mortgage payments slightly decreased in Q4, as mortgage rates hovered between 6.12% and 6.85%.
- The monthly mortgage payment on a typical existing single-family home with 20% down dropped 0.8% to $2,124 (down $37 from a year ago).
- First-time buyers saw their monthly payments on a starter home fall to $2,083, a 1.7% drop from last year.
- Affordability remains tight: A family now needs at least $100,000 in income to afford a home in 43.8% of markets—up from 42.5% in the previous quarter.
Despite these small improvements, affordability challenges are still very real. Buyers need to be educated on their options, especially in high-cost markets.
About 4 in 10 (43.8%) metro areas required a qualifying income of at least $100,000 for a 10% down payment mortgage (up from 42.5% in Q3). And only 2.2% of metro areas had homes affordable to families earning less than $50,000
With home prices on the rise, affordability gains are minimal. Buyers hoping for relief in 2025 will need to watch how mortgage rates and inventory levels shift in the coming months.
What This Means for Agents
The real estate market continues to evolve, with home prices climbing in most metro areas and affordability remaining a key challenge for buyers. While these trends create opportunities for sellers, agents need to stay ahead of the latest data and market shifts to provide the best guidance for their clients.
To stay informed on housing trends, mortgage rates, and breaking industry news, tune in to the daily Hot Sheet with Byron Lazine, whose expert insights will keep you up to speed on the latest news in real estate.
How will you present this data to your clients and community?