


Realtor.com just doubled its Market Clock tool to 100 metros, and the expanded view confirms the 2026 spring market was the most buyer-friendly spring since 2018.
The national reading still sits at a steady 3 o’clock, balanced and leaning toward buyers. The full data set shows 70% of the top 100 metros favor buyers or are trending that way.
Here’s what the numbers show and where conditions are moving fastest.
Data Shows a National Buyer’s Market
The headline numbers from this quarter’s reading:
- 70% of the top 100 metros favor buyers or are trending that way, up from 52% a year ago
- Buyer’s markets make up 19% of the top 100, the largest second-quarter share since 2019
- Seller’s markets have shrunk to 25% of metros, down from 96% in 2022
- Markets are spread across 9 of the clock’s 12 positions, the most even distribution since spring 2020
- No single quadrant holds more than half of all metros
For a visual reference, here’s an example of a Market Clock reading for St. Paul, Minnesota:
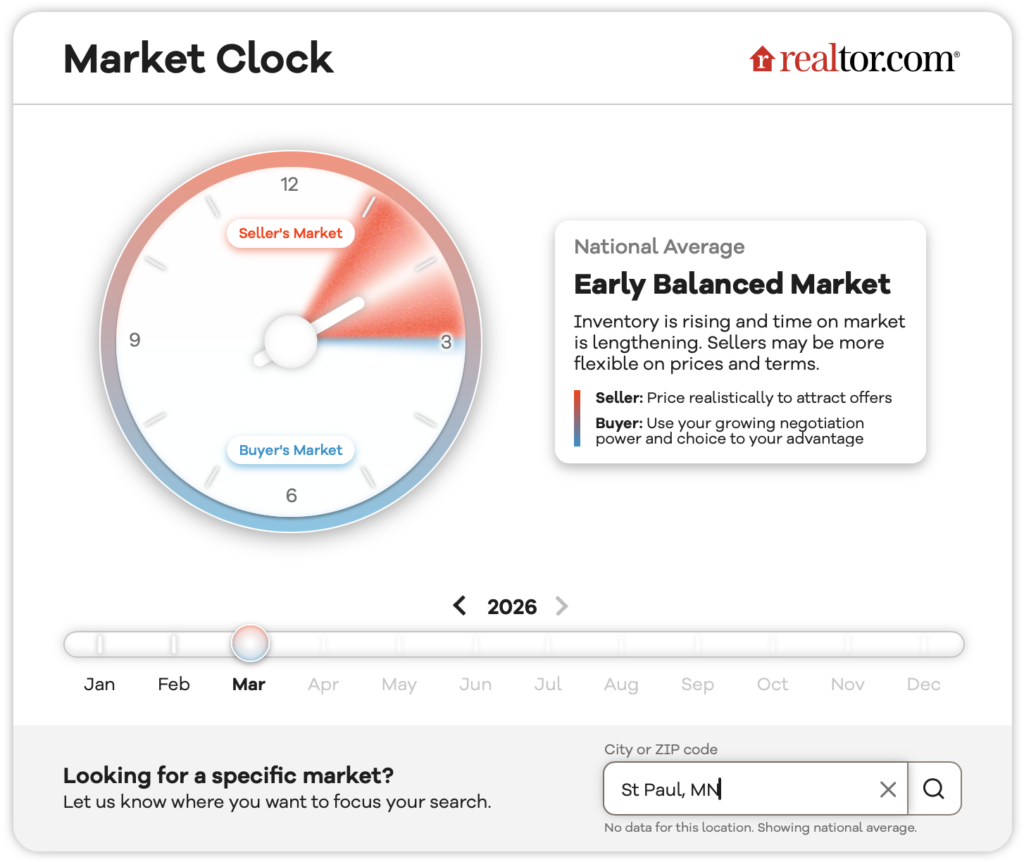
Source: Realtor.com
Three years ago, almost every metro in the country favored sellers. Today, a quarter of them do.
Jake Krimmel, senior economist at Realtor.com, said the expanded data set is what makes this reading different from a single national number.
“A national number can only tell you so much. What the Market Clock® shows this quarter is a country moving toward buyers, but at very different speeds depending on where you live. Doubling our coverage to 100 metros lets us show that fragmentation and broad-based buyer-friendly momentum in a way a single headline number never could.”
Where You Work Decides the Pace
The South holds 18 of the 19 buyer’s markets in the country right now. If your business runs through Southern metros, you’re likely already negotiating from a different footing than your colleagues elsewhere.
Meanwhile, the Midwest looks nothing like it.
Two-thirds of Midwestern metros are still tilted toward sellers, and none have crossed into buyer’s territory yet. The Northeast holds every single balanced-tightening metro in the country, including Hartford, the only market still sitting at 12 o’clock, the clock’s peak-seller position.
Some markets moved fast enough over the past year that agents working them should already be adjusting their playbook.
Realtor.com named these among the 21 metros that loosened a full two hours over the past 12 months:
- Augusta, GA
- Bakersfield, CA
- Charlotte, NC
- Cleveland, OH
- Greenville, SC
- Nashville, TN
- Portland, ME
- Providence, RI
- San Antonio, TX
- Syracuse, NY
Two metros moved even further. Colorado Springs swung from a balanced 3 o’clock to 7 o’clock in twelve months, crossing past the peak-buyer position entirely. Oxnard, Calif. moved five hours, from 10 o’clock to 3 o’clock, the largest move of any metro in the report.
The report also flagged the biggest movers of just the past quarter. Six metros moved two full hours toward buyers between Q1 and Q2 2026:
- Cape Coral, FL (5 to 7 o’clock)
- Cleveland, OH (1 to 3 o’clock)
- North Port, FL (5 to 7 o’clock)
- Portland, ME (1 to 3 o’clock)
- Providence, RI (1 to 3 o’clock)
- Syracuse, NY (2 to 4 o’clock)
Three metros moved two hours the other direction, toward sellers:
- Bridgeport, CT (10 to 8 o’clock)
- El Paso, TX (4 to 2 o’clock)
- Fresno, CA (4 to 2 o’clock)
Every other metro in the top 100 moved one hour or less this quarter.
Krimmel called the regional split the clearest his team has measured.
“Two-thirds of Midwestern metros are still tilted toward sellers, and not one has crossed into buyer’s territory. Meanwhile, a buyer shopping in the South is working with nearly the opposite market and it’s the clearest regional split we’ve measured.”
Sellers Are Pricing Like They Know It, Too
Leverage on paper is one thing. Sellers adjusting their behavior is the proof point agents should be working into their conversations with buyers and sellers.
The latest pricing data shows it happening:
- Listing prices per square foot fell year over year in 60 of the top 100 metros, up from 46 a year ago and just 3 in 2022
- Nationally, the median list price is down roughly 2.5% from a year ago
In outright buyer’s markets, price cuts remain elevated at roughly 1 in 5 listings. Cut shares are falling, though, which tells us sellers are pricing right the first time instead of correcting later.
Fifty-seven percent of Southern metros and 55% of Western metros show both falling prices and falling cut shares.
Another bright spot is pending sales, which have risen year over year for seven straight months, the most active spring market in four years.
Krimmel connected the pricing realism directly to the rise in pending sales.
“Pricing realism is what buyer leverage looks like in action. Sellers in the South and West are getting the message and pricing accordingly, and it’s paying off — pending sales have now risen for seven straight months, which is the most active spring market we’ve seen in four years.”
Three things from this report are worth tracking into next quarter:
- Memphis, San Antonio and Houston: three of nine late-balanced metros on the edge of buyer’s territory
- Cape Coral and North Port, FL: ticking back from peak buyer conditions, a signal worth watching for Q3’s national buyer share
- Poughkeepsie, Albany and Bridgeport, NY: the only metros where sellers are regaining ground
If you work in a metro nearing that crossover into buyer’s territory, start prepping sellers for the pricing conversation now, before the crossover shows up in your own local data.