
BAM Key Details:
- Realtor.com’s 2026 Hottest ZIP Codes report shows Peabody, MA leading the nation with a median of 20 days on market and a $600,000 median listing price.
- The top 10 ZIPs pulled in up to 5.3 times more views per listing than the national average and sold up to 42 days faster.
- Buyers in these markets put down an average of 17.1%, well above the national average of 13.1%.
Peabody, Massachusetts just took the No. 1 spot on Realtor.com’s 2026 Hottest ZIP Codes report. Homes in the top 10 ZIPs on this year’s list pulled in up to 5.3 times more views per listing than the national average and sold up to 42 days faster.
Most of the country sold homes below asking price in the first half of 2026.
Buyers in these 10 ZIP codes paid above asking, and many arrived with bigger down payments and stronger credit scores than the national norm.
Read on for the top 10 list and what agents can take from it.
This Year’s Top 10 Zip Codes
Peabody, Massachusetts (01960) took the No. 1 spot on this year’s list. It’s the third time this North Shore Boston suburb has made the top 10, following a No. 5 finish in 2018 and a No. 3 finish in 2021.
Here’s the full top 10, in rank order:
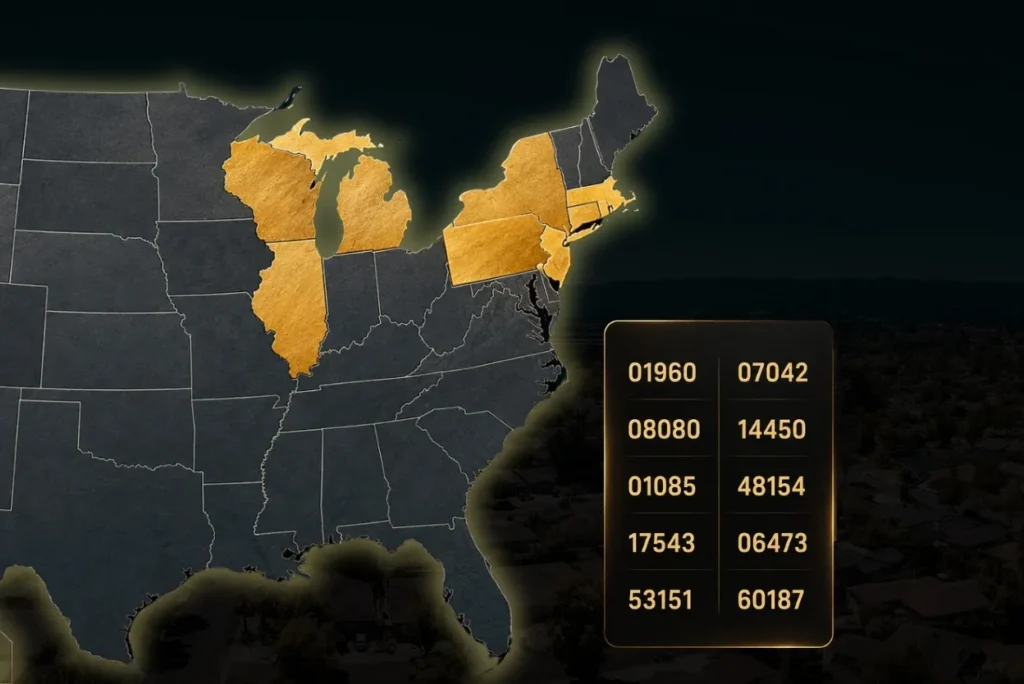
- Peabody, MA (01960), Boston-Cambridge-Newton, MA-NH
- Montclair, NJ (07042), New York-Newark-Jersey City, NY-NJ
- Sewell, NJ (08080), Philadelphia-Camden-Wilmington, PA-NJ-DE-MD
- Fairport, NY (14450), Rochester, NY
- Westfield, MA (01085), Springfield, MA
- Livonia, MI (48154), Detroit-Warren-Dearborn, MI
- Lititz, PA (17543), Lancaster, PA
- North Haven, CT (06473), New Haven, CT
- New Berlin, WI (53151), Milwaukee-Waukesha, WI
- Wheaton, IL (60187), Chicago-Naperville-Elgin, IL-IN
Three of these ZIPs are first-timers in every sense: Lititz, North Haven, and New Berlin.
Demand is spreading into smaller markets inside the same Northeast and Midwest corridors that have dominated this list for years.
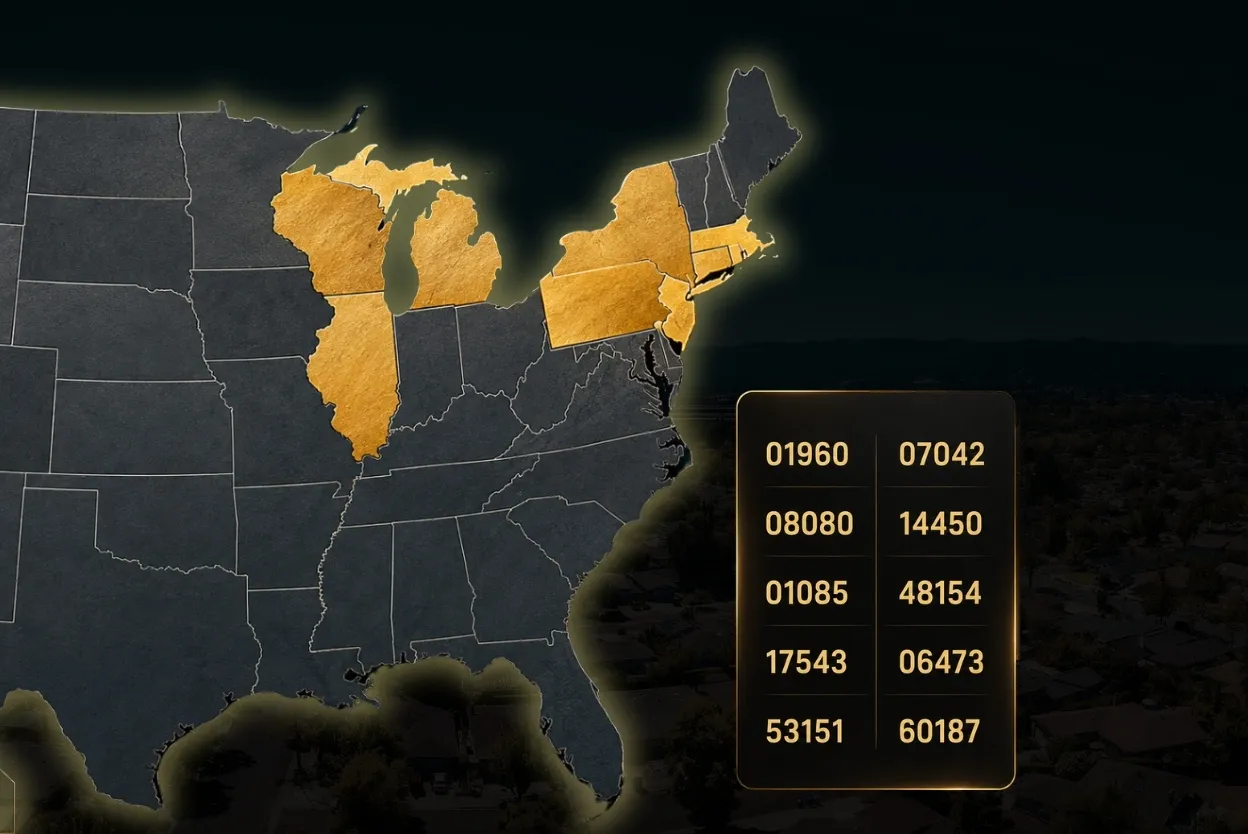
For a fourth straight year, no ZIP from the South or West cracked the list. Northeast and Midwest metros filled every spot, across MA, NJ, NY, CT, PA, WI, IL, and MI.
Hannah Jones, senior economist at Realtor.com, points to what’s behind the sweep:
“This year’s hottest ZIP codes tell us that buyers aren’t simply chasing the lowest price tag anymore—they’re chasing space, character and a manageable commute to a major job center, and they’re willing to pay a premium to get it. What’s especially notable is how financially prepared these buyers are. Even in ZIP codes where typical local incomes aren’t enough to cover today’s home prices, buyers are showing up with larger down payments and stronger credit profiles than the national norm, which tells us this demand is real and well-capitalized.”
Why Buyers Are Paying A Premium
The report breaks down what these buyers are willing to pay more for. Here’s what that looks like in the numbers:
- Size: The median home for sale across the top 10 measured 2,000 square feet, compared with 1,600 in the surrounding metros and 1,800 across the country. In Montclair, homes averaged 2,625 square feet, 85.6% larger than the surrounding New York metro.
- Age: The median year built across the 10 ZIPs is 1970, about a decade older than the all-ZIP average, a sign of demand for established neighborhoods over new construction.
- Commute: All 10 ZIPs sit 10 to 20 miles from their metro’s central business district, close enough for a regular office schedule and far enough for more space and quiet.
Final sale prices show how much of a premium buyers are willing to pay. Nine of the 10 ZIPs are priced above their surrounding metro. The average sale-to-list ratio across the group is 103.8%. Montclair sold 16.7% over asking. Fairport sold 14.4% over asking.
Buyers Are Showing Up Prepared
Buyer financial profiles in these ZIP codes run higher than the national norm across the board.
- The average down payment across the list is 17.1%, compared with a national average of about 13.1%.
- The average median credit score is 766, compared with a national average of about 747.
Montclair buyers posted the strongest profile in the group: a 22.1% average down payment, more than $318,000, alongside a median credit score of 783.
The ZIPs at the lower end of the range beat the national dollar norm, too.
- Westfield buyers put down $30,000.
- Peabody buyers put down $89,000.
Both numbers top the $25,300 national average down payment.
Income doesn’t always match home prices in these ZIPs. Livonia incomes run 64.2% ahead of what’s needed to afford the median home there. Montclair incomes run 31.1% behind, a sign of how far home values have outpaced local earnings.
What This Means For Your Market
National for-sale inventory sat 11.3% below pre-pandemic levels in June 2026. In the ten hottest ZIPs, the shortfall reached 60.5%, over five times the national figure.
The shortfall explains the multiple-offer, over-asking behavior showing up across this list.
Whatever market you serve, if your ZIP isn’t among the top 10:
- Pull the same three numbers for your own market: the inventory shortfall against pre-pandemic levels, median days on market, and the sale-to-list ratio. Use them to set expectations with buyers before they write an offer.
- Look for the older, well-located pocket in your market with more space than typical inventory. Position it around the trade buyers are making here, not on price alone.
Pull your own numbers before your next listing appointment. Buyers here are showing you what they’ll pay for, and it’s not just price.
Every Market Has Its Own Peabody
The individual ZIP codes on this list are less important than the pattern behind them. Buyers everywhere are paying for more space and an easier commute. They want established character in a neighborhood too, not just more margin in their housing budget.
Every agent has a version of this story close to home. Pull the real numbers for your own market and put them in front of buyers and sellers this week