
BAM Key Details:
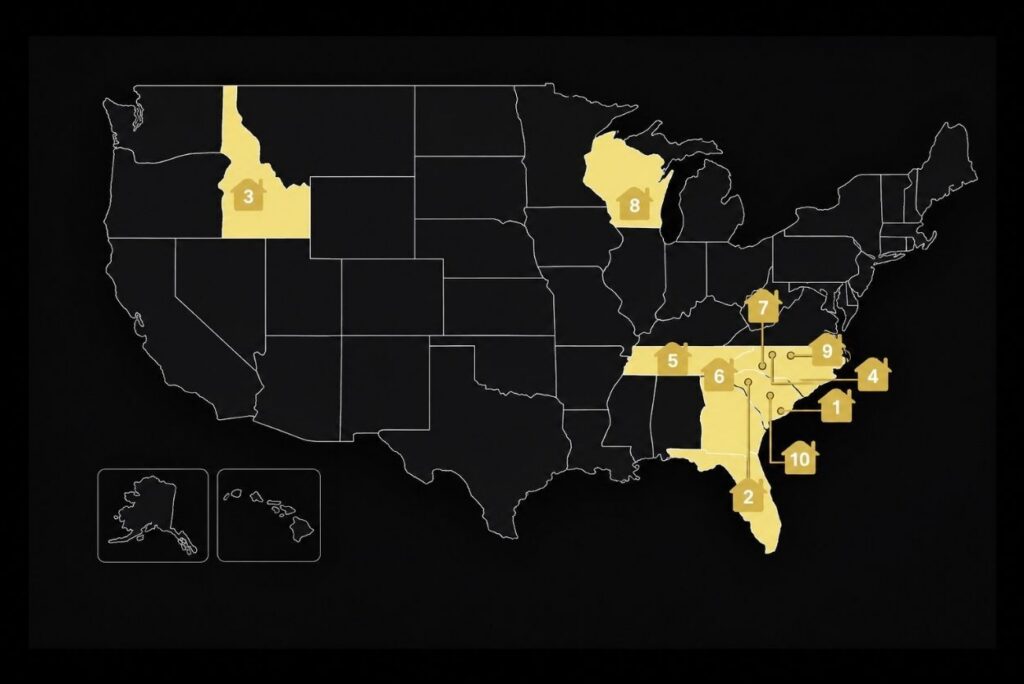
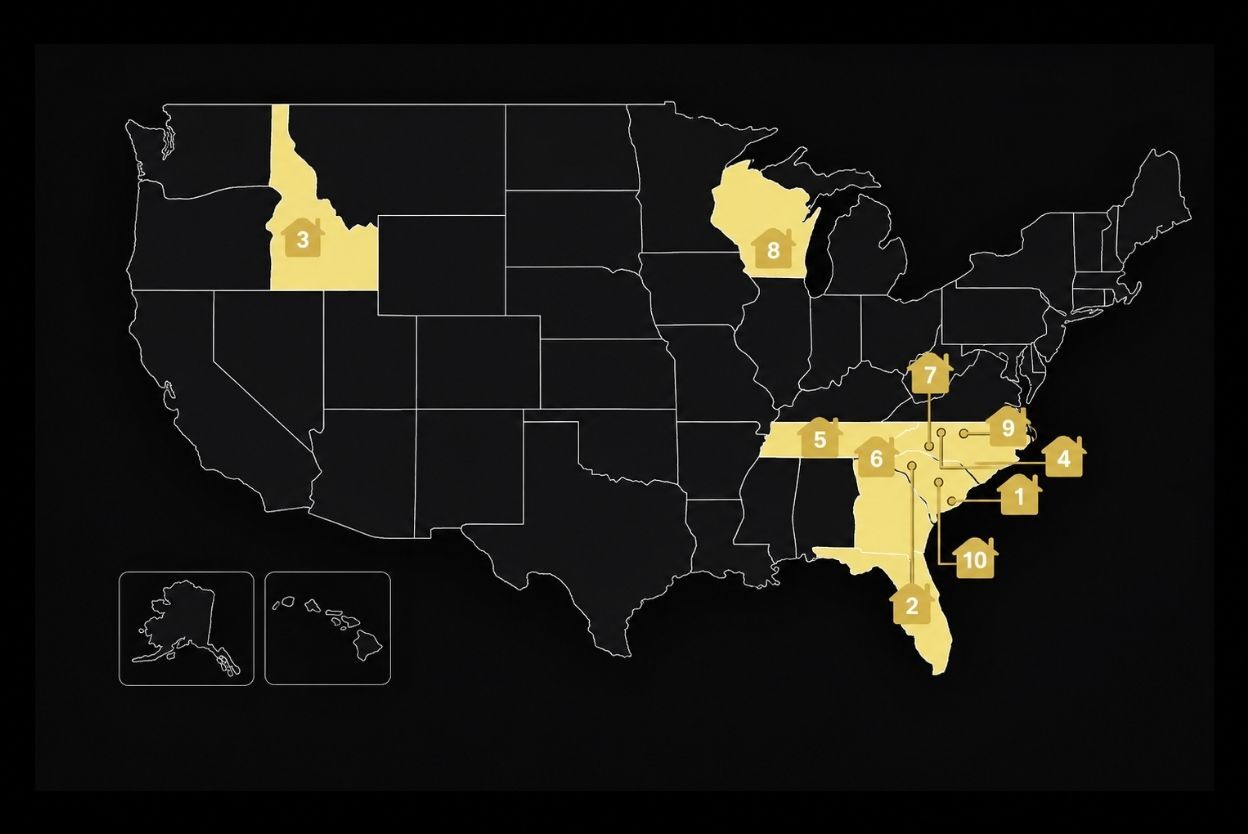
- Charleston-North Charleston, SC ranks as the number one metro for new construction with a median new-build list price of $443,273 vs. $504,832 for existing homes.
- Eight of the top 10 metros are in the South. Six are in the Carolinas and two in Tennessee.
- The Agent Play: Look up the new-construction premium in your own market. If new builds list at or below your existing-home median, that number is a month of content and a listing appointment talking point.
Realtor.com released its second annual Top Metros for New Construction report this week, ranking the 100 largest U.S. metros on how much new-construction inventory they have, how new-build prices compare to resale, climate risk, and buyer demand.
Eight of the top 10 metros are in the South, and in four of them the median new home is listing for less than the median existing home. Below is the full top 10, plus how to turn your own market’s new-versus-resale numbers into content.
Which metros ranked highest for new construction in 2026?
Realtor.com scored the 100 largest U.S. metros on four weighted measures: new-construction share of listings (33%), new-construction premium (33%), difference in climate risk between new and existing homes (17%), and market hotness (17%). The data covers listings from January 1 through June 30, 2026.
Here’s the top 10 new construction markets in 2026:
#1: Charleston-North Charleston, SC
- New Construction Share of Listings: 24.8%
- New Construction Premium (vs. Existing Home): -12.2%
- New Construction Days on Market: 48
#2: Greenville-Anderson-Greer, SC
- New Construction Share of Listings: 33.4%
- New Construction Premium (vs. Existing Home): -1.6%
- New Construction Days on Market: 60
#3: Boise City, ID
- New Construction Share of Listings: 53.4%
- New Construction Premium (vs. Existing Home): -4.5%
- New Construction Days on Market: 61
#4: Charlotte-Concord-Gastonia, NC-SC
- New Construction Share of Listings: 29.5%
- New Construction Premium (vs. Existing Home): 4.7%
- New Construction Days on Market: 65
#5: Nashville-Davidson-Murfreesboro-Franklin, TN
- New Construction Share of Listings: 30.1%
- New Construction Premium (vs. Existing Home): 5.1%
- New Construction Days on Market: 52
#6: Chattanooga, TN-GA
- New Construction Share of Listings: 26.8%
- New Construction Premium (vs. Existing Home): 10.1%
- New Construction Days on Market: 66
#7: Winston-Salem, NC
- New Construction Share of Listings: 33.0%
- New Construction Premium (vs. Existing Home): 9.7%
- New Construction Days on Market: 64
#8: Madison, WI
- New Construction Share of Listings: 30.8%
- New Construction Premium (vs. Existing Home): 12.5%
- New Construction Days on Market: 70
#9: Durham-Chapel Hill, NC
- New Construction Share of Listings: 33.0%
- New Construction Premium (vs. Existing Home): 8.7%
- New Construction Days on Market: 68
#10: Columbia, SC
- New Construction Share of Listings: 25.5%
- New Construction Premium (vs. Existing Home): -3.0%
- New Construction Days on Market: 45
Four top-10 metros have a negative new-construction premium, meaning the median new home price is below existing home prices. The median new home price in Charleston is $443,273 vs. $504,832 for existing homes, a 12.2% discount, followed by Boise (-4.5%), Columbia (-3.0%), and Greenville (-1.6%).
Boise stands out because more than half of its listings, 53.4%, are new construction. Madison, meanwhile, had the strongest shopper interest in the top 10, with page views per new-construction listing running 108.4% above the national average.
Southern Metros Dominate New Construction
Eight of the top 10 metros are in the South, with six in the Carolinas and two in Tennessee. The South sees more new builds due to more permissive zoning, less restrictive building codes, and lower land costs, according to Realtor.com.
Joel Berner, senior economist at Realtor.com, stated:
“New construction is one of the most important ways to expand the supply of homes available to buyers, but the opportunity is not evenly distributed across the country. This year’s ranking shows that Southern metros are not only building more homes; they are also creating conditions where buyers can find newly built homes at prices that compete with, and in some cases beat, existing homes.”
The Agent Play
In July, new home sales dropped 10.5% month-over-month, and the median new home price fell to $393,800, roughly $40,000 below the $434,100 median price of an existing home nationwide. This new Realtor.com data gives agents a reason to take that story hyperlocal.
Start by looking at the new developments in your market and comparing their prices with nearby resale inventory.
If a buyer can purchase new construction for roughly the same price (or less) that is a content hook.
Instead of posting another generic model-home tour, make the price comparison the story. Here are a few ideas to get you started:
- The side-by-side. One builder spec home, one comparable resale listing, same price band. Caption: “New construction in [Market] is listing X% below resale right now. Here’s what that actually looks like at $[price].”
- The map. Create a map to pinpoint the developments pricing under your local existing-home median. This is the post that gets saved and shared.
- The correction post. “Everyone assumes new construction costs more. In [Market], the data says otherwise.” Then show both medians.
- The green screen. If your market shows up on Realtor.com’s top 10 list, green screen the article and share what you are seeing locally.
From there, you can develop an entire content series or even a weekly newsletter where you:
- Compare developments
- Break down builder incentives
- Show what monthly payments look like
- Tour a new home and then a similarly priced resale nearby.
The agent’s value is showing them where the numbers create an opportunity and where they don’t.
With new construction accounting for roughly one-quarter to more than half of inventory in some of Realtor.com’s top markets, agents who understand that inventory have plenty of material to work with.