

Key Details:
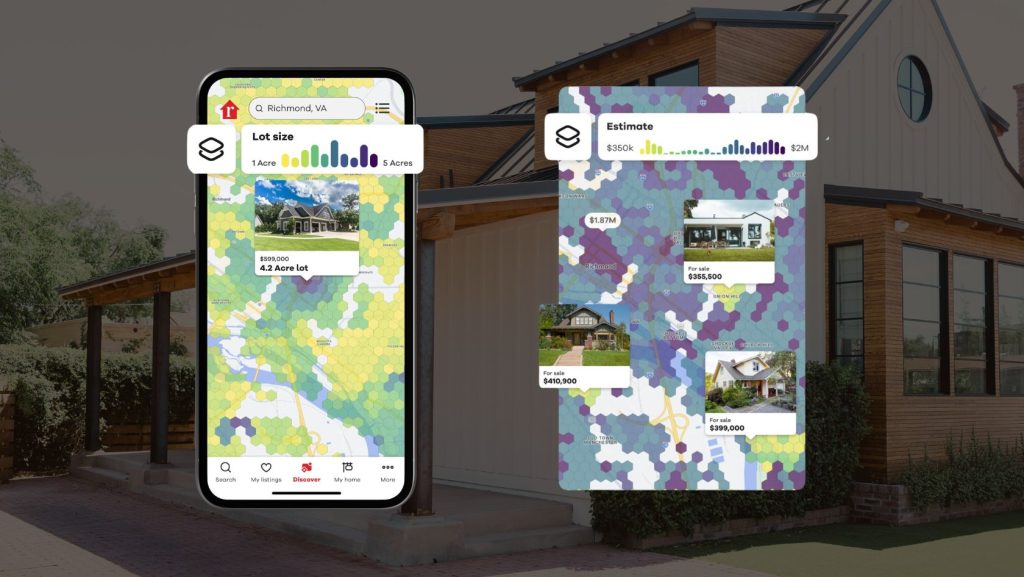
- Realtor.com® introduces dynamic map layers, a new set of interactive search features that make it easier for homebuyers to compare properties and explore neighborhoods.
- The map layers offer real-time data on home values, market trends, and more to assist users with informed decision-making.
Realtor.com® has launched dynamic map layers that allow users to quickly find answers to key questions like:
- “Is this house the best deal on the street” or “…in the neighborhood?”
- “Where can I find the newest homes near [school]?”
- “How quickly are homes selling in this neighborhood?”
- “Do any homes on this street fit my budget?”
The new search features allow Realtor.com users to explore a particular ZIP code or neighborhood and easily find relevant home data based on real-time visualizations with hyperlocal insights as well as broader neighborhood trends.
The map layers feature dynamic zoom and pan capabilities, allowing users to adjust data visuals from a broad to granular level based on their preferences.
User Benefits and Survey Insights
According to a Realtor.com survey, 71% of real estate app users want more map-based features to enable them to compare homes in a specific location more effectively.

Nine of ten users (90%) said they would appreciate the ability to search for criteria such as “home size” and “home value” via map tools.
So, as of today, dynamic map layers present property and market data in an interactive, easy-to-understand format, enabling users to make homebuying decisions with more confidence.

Dynamic Map Layer Options and Features
- Home Estimate: Uses RealEstimate data to show the current estimated value of a home.
- Estimate/ sq ft: Provides the estimated home value divided by square footage, also powered by RealEstimate.
- Lot Size: Displays the property’s lot size in acres.
- Lot Slope: Highlights the average slope of the lot.
- Market Hotness: Shows how quickly homes in a particular neighborhood are selling, ranging from 1 (cool) to 100 (very hot).
- Sold Price vs. List Price: Indicates sold price as a percentage of the property’s original list price, based on data from the previous year.
- Days on Market: Displays how long properties in a particular neighborhood typically take to sell, based on recent sales data.
- Neighborhood: Displays boundaries, homes on the market, median days on market, and median list price for a neighborhood.
The new dynamic map layers are available on both desktop and mobile.