


Key Details:
- The recent release of the Agent Movement Index (AMI) report for April 2024 shows surprising trends in agent count as well as agent movement between brokerages.
- The Relitix report highlights the top three indicators for industry leaders to consider, especially with regards to the continued increase in agent mobility.
Relitix has released its Agent Movement Index™ (AMI) for April 2024. And the numbers show a surprising new trend in agent dynamics—most notably an increase in the number of active real estate agents.
And that’s just one aspect of an overall shift in the dynamics of real estate agents.
Another is the increase in the number of agents moving from one brokerage to another, which may be partly due to ongoing litigation, including but not limited to lawsuits on agent commissions.
The industry is going through significant changes, and not every brokerage is equipped to help its agents thrive over the next 10 years.
Key Highlights from the April 2024 AMI
The Relitix report points out three meaningful trends in the Agent Movement Index (AMI) for April 2024:
- Active agents are growing in number—contrary to the decline observed in recent months. The new upward trend suggests more people are seeing growth potential in a career as a real estate agent.
- More agents moving between brokerages—agent mobility has continued to increase since early fall of 2023 as more agents see a clear benefit to switching from one brokerage to another.
- April movement outpaced March—though March is typically the peak month of the year for agent movement. In only a few other years (including high-movement years 2018 and 2019) has April outperformed March.


April’s data highlight a fascinating turnaround in agent activity and movement. The increase in active agents, paired with their mobility between brokerages, signals a potentially more robust market ahead. We remain vigilant in monitoring how the NAR settlement will shape the future of our industry.
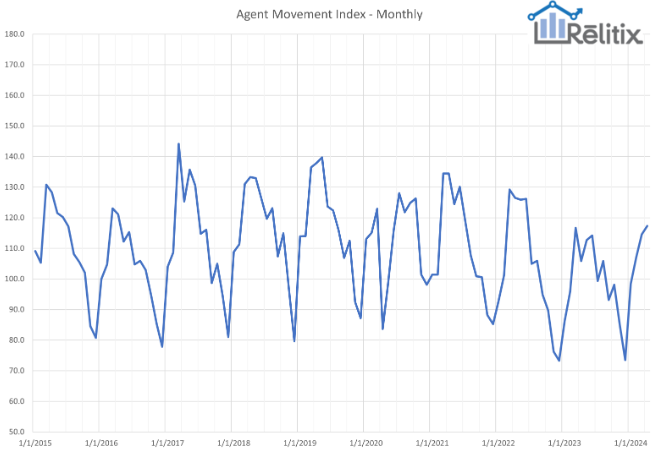
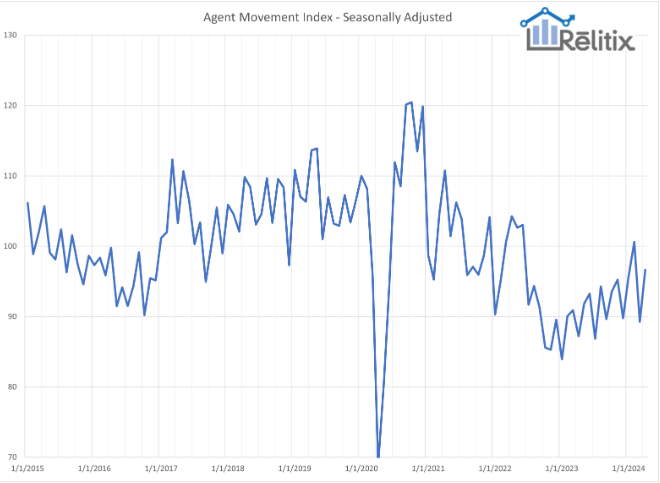
The AMI score for April reached 117.3, with the seasonally adjusted number a bit higher at 122.4. As the monthly chart below shows, the peak typically happens before April, while this year, April’s score is clearly above that of the previous month.
Brokerage and franchise leaders are well-advised to consider not only the national trends in agent movement but their own numbers tracking the inflow and outflow of experienced agents.
While it’s true that agent movement between brokerages does fluctuate on a seasonal and long-term basis, brokerages with relatively high numbers of agents leaving can use this data as a starting point for conversations about agent retention.
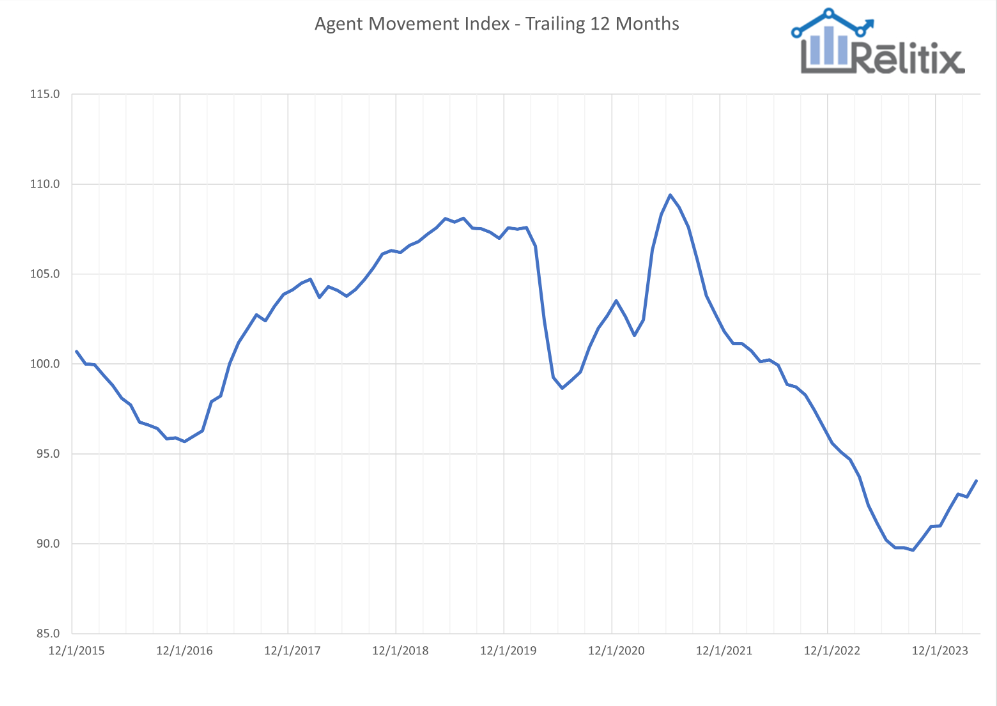
That’s why Relitix created its Agent Movement Index™: to capture these trends in agent numbers and movement and report them to the industry in a usable format.
The AMI uses national data from some of the most prominent MLS systems in the U.S. to track agent movement dynamics. The report goes out monthly and includes both raw and seasonally adjusted figures to make underlying trends easier to spot.
The AMI score is based on an estimate of the number of agents who switched brokerages in a given month.
Read the full report for more information, including methodology.


