
Home prices rose 2.1% year-over-year nationally in the second quarter of 2026, up from 1.9% in the first quarter.
Headlines have spent years predicting a housing crash, but the Federal Housing Finance Agency‘s newest data shows prices climbed in 47 of the 50 states plus Washington, D.C.
This report breaks down the states and metro areas posting the strongest annual gains, plus the ones where prices dipped. It also translates the data into a play agents can use to show clients what’s really happening in their own markets.
Let’s get into it.
State Rankings: Where Home Prices Rose and Fell the Most
Among the 50 states and Washington, D.C., 47 posted annual gains. Four states didn’t.
These are the 10 states with the strongest annual price growth in FHFA’s Q2 2026 index:
- Alaska (8.3%)
- Vermont (7.3%)
- Hawaii (5.8%)
- Illinois (5.6%)
- West Virginia (5.6%)
- Wisconsin (4.8%)
- North Dakota (4.8%)
- Connecticut (4.7%)
- Rhode Island (4.7%)
- New Jersey (4.6%)
No single region dominates this list. The Northeast and the Midwest each place more than one state here. NAHB points to limited housing supply as one reason prices keep climbing in those markets.
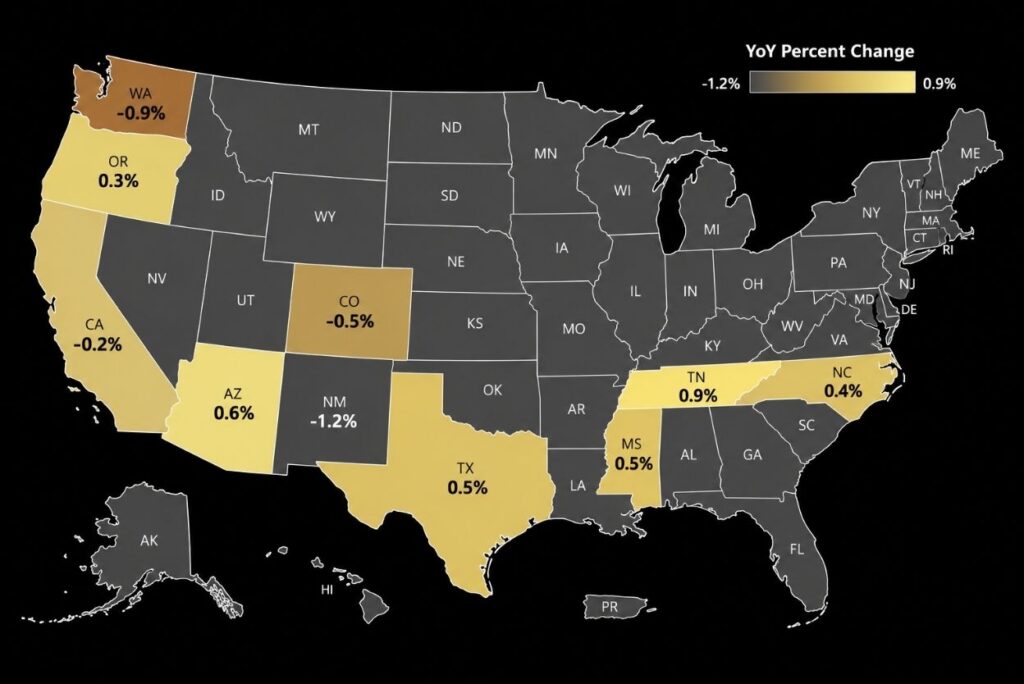
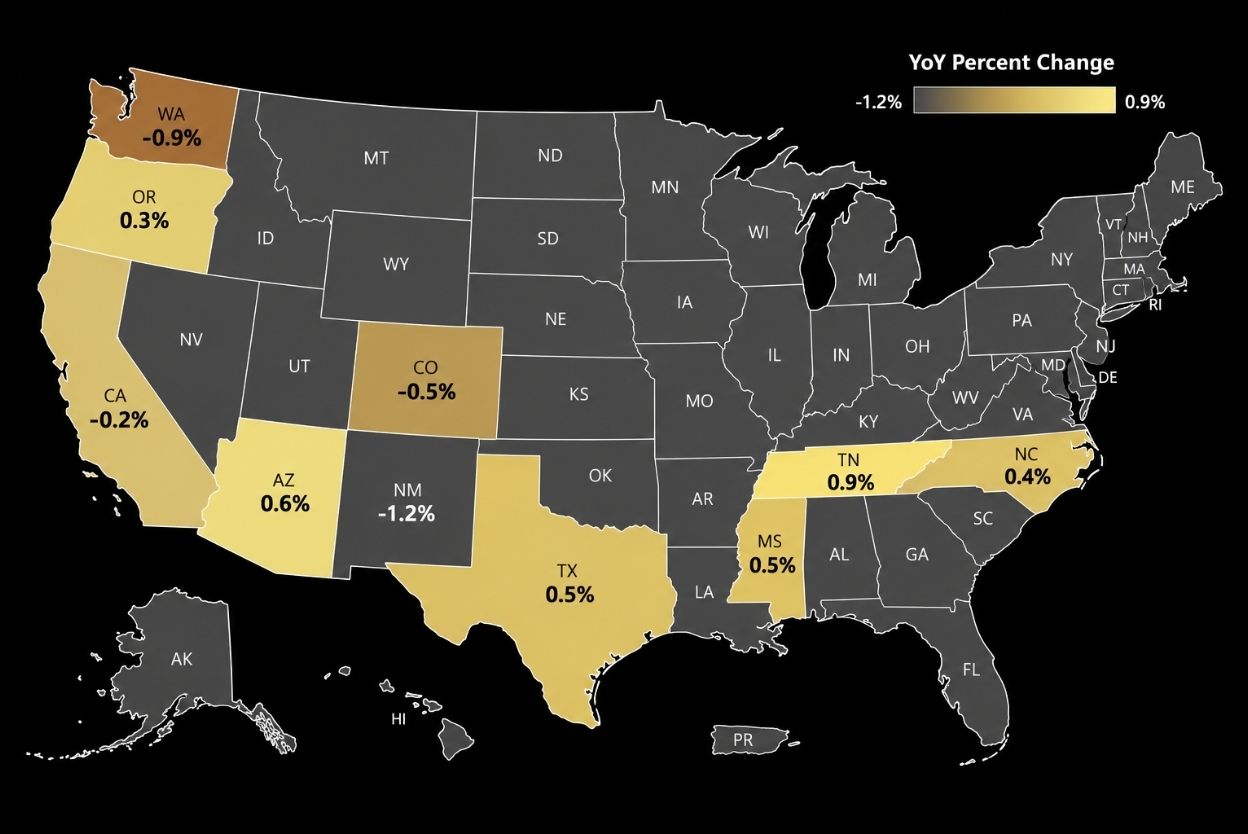
Now for the states where prices moved the other way. These are the 10 with the softest annual performance:
- New Mexico (-1.2%)
- Washington (-0.9%)
- Colorado (-0.5%)
- California (-0.2%)
- Oregon (0.3%)
- North Carolina (0.4%)
- Texas (0.5%)
- Mississippi (0.5%)
- Arizona (0.6%)
- Tennessee (0.9%)

Four states posted an outright decline over the past year: New Mexico, Washington, Colorado, and California. New Mexico’s drop was the steepest, at 1.2%, a modest pullback given how much the market climbed earlier in the decade.
NAHB describes the softness in Oregon, North Carolina, Texas, Mississippi and Arizona as a continued cooldown in Western and Sun Belt markets, the same places that saw the fastest price growth during the pandemic years.
Metro Rankings: Where Home Prices Rose and Fell the Most
Metro-level numbers likewise show more growth than decline. Annual price changes across the 100 largest metro areas ranged from a 7.7% gain to a 3.7% decline in Q2 2026.
Top 10 metros by annual price growth:
- Elgin, IL (7.7%)
- Allentown-Bethlehem-Easton, PA-NJ (7.0%)
- Bridgeport-Stamford-Danbury, CT (6.6%)
- Charleston-North Charleston, SC (6.5%)
- El Paso, TX (6.5%)
- Milwaukee-Waukesha, WI (6.1%)
- Chicago-Naperville-Schaumburg, IL (5.9%)
- New York-Jersey City-White Plains, NY-NJ (5.6%)
- Newark, NJ (5.5%)
- Greensboro-High Point, NC (5.3%)
Several of these metros sit in states that didn’t make the state-level top 10. Price growth can vary a lot within a single state.
Bottom 10 metros by annual price change:
- Everett, WA (-3.7%)
- San Antonio-New Braunfels, TX (-3.0%)
- Bakersfield-Delano, CA (-2.6%)
- Seattle-Bellevue-Kent, WA (-2.4%)
- San Francisco-San Mateo-Redwood City, CA (-2.4%)
- Tucson, AZ (-2.2%)
- Albuquerque, NM (-1.7%)
- San Jose-Sunnyvale-Santa Clara, CA (-1.6%)
- Washington, D.C.-Maryland (-1.0%)
- Denver-Aurora-Centennial, CO (-1.0%)

Everett, Washington posted the sharpest metro-level decline at 3.7%, more than triple New Mexico’s statewide drop of 1.2%. A state can look fine on average while one of its metros is still cooling underneath that number.
Quarter-over-quarter numbers can look more dramatic than the annual trend. San Francisco’s metro area fell 9.1% from the first quarter to the second, the largest quarterly drop among the 100 metros. Its year-over-year decline was a calmer 2.4%.
The Play for Agents
The data and maps from FHFA and NAHB make it easy to turn this news into content. Here’s the format:
- Use the NAHB state or metro map as the backdrop for a green screen
- Share the annual change for your specific market
- Say whether your local trend matches the national one
From there, add context on what you’re seeing on the ground:
- Inventory levels
- Days on market
- Price reductions
- Buyer demand
- Differences by price point
NAHB names two forces behind this year’s numbers: elevated borrowing costs and affordability pressure, and limited housing supply keeping prices propped up in tighter markets. Either one gives you something to say about your own market beyond the headline number.
Here’s a line you can adapt on camera for your opening hook:
“Home prices are falling….or so the headlines keep saying. Here’s what FHFA’s newest numbers show in [state or metro].”
Close your video with a question or an invitation. Something like:
“Want to know what home values are doing in your neighborhood?”
Bookmark this article. The next time a client brings up a crash headline, you’ll have the real numbers for your market ready to go.